June 2025 Monthly Market Insights
June 2025 Monthly Market Insights
Data and opinions as of May 31, 2025
Equity rebound, bond yield shifts, and tax policy debates
May 2025 saw global markets navigate a complex landscape of extended tariff truces, shifting bond yield dynamics, and the unveiling of President Trump’s tax plan. The 90-day tariff pause with China, announced May 9, sustained an equity rally, though markets showed muted responses to Trump’s tariff rhetoric on the EU. Corporate earnings remained robust, particularly in AI-driven sectors, but tariff uncertainty restrained forward guidance. In bond markets, surging Japanese yields and a potential yen carry trade unwind challenged U.S. Treasuries’ dominance as a safe-haven. Meanwhile, Trump’s tax plan, with its focus on corporate tax cuts, stirred debate over fiscal sustainability. Central banks, including the U.S. Federal Reserve (Fed), European Central Bank (ECB), Bank of England (BoE), and Bank of Canada (BoC), grappled with balancing inflation and growth amid divergent regional pressures.
NEI perspectives
Equity rebound: tactical relief amid persistent risks. The 90-day tariff truce with China, announced May 9, spurred a global equity rally, with markets pricing in temporary pauses to President Trump’s tariff strategy. Strong corporate earnings, particularly in AI, support optimism, but tariff uncertainty tempers guidance. Bottom line: The rally offers tactical opportunities, but diversified portfolios remain essential to navigate lingering trade risks.
Bond markets: U.S. exceptionalism questioned. Surging Japanese bond yields, reaching 1.57% for 10-yearJGBs, and a potential yen carry trade unwind are prompting investors to reassess U.S. Treasuries as the sole safe-haven. Bottom line: Diversifying into non-U.S. safe-havens like gold or yen-denominated assets can hedge against shifting global yield dynamics.
Trump’s tax plan: growth vs. fiscal concerns. Trump’s tax proposal, reducing corporate rates to 15% and offering manufacturing credits funded by tariffs, has mixed reactions. Growth proponents see benefits, while fiscal deficit hawks warn of a $2 trillion debt increase over a decade. Bottom line: Investors should monitor fiscal policy impacts on inflation and yields, favoring flexible asset allocation to balance risks and opportunities.
‒ NEI Asset Allocation team
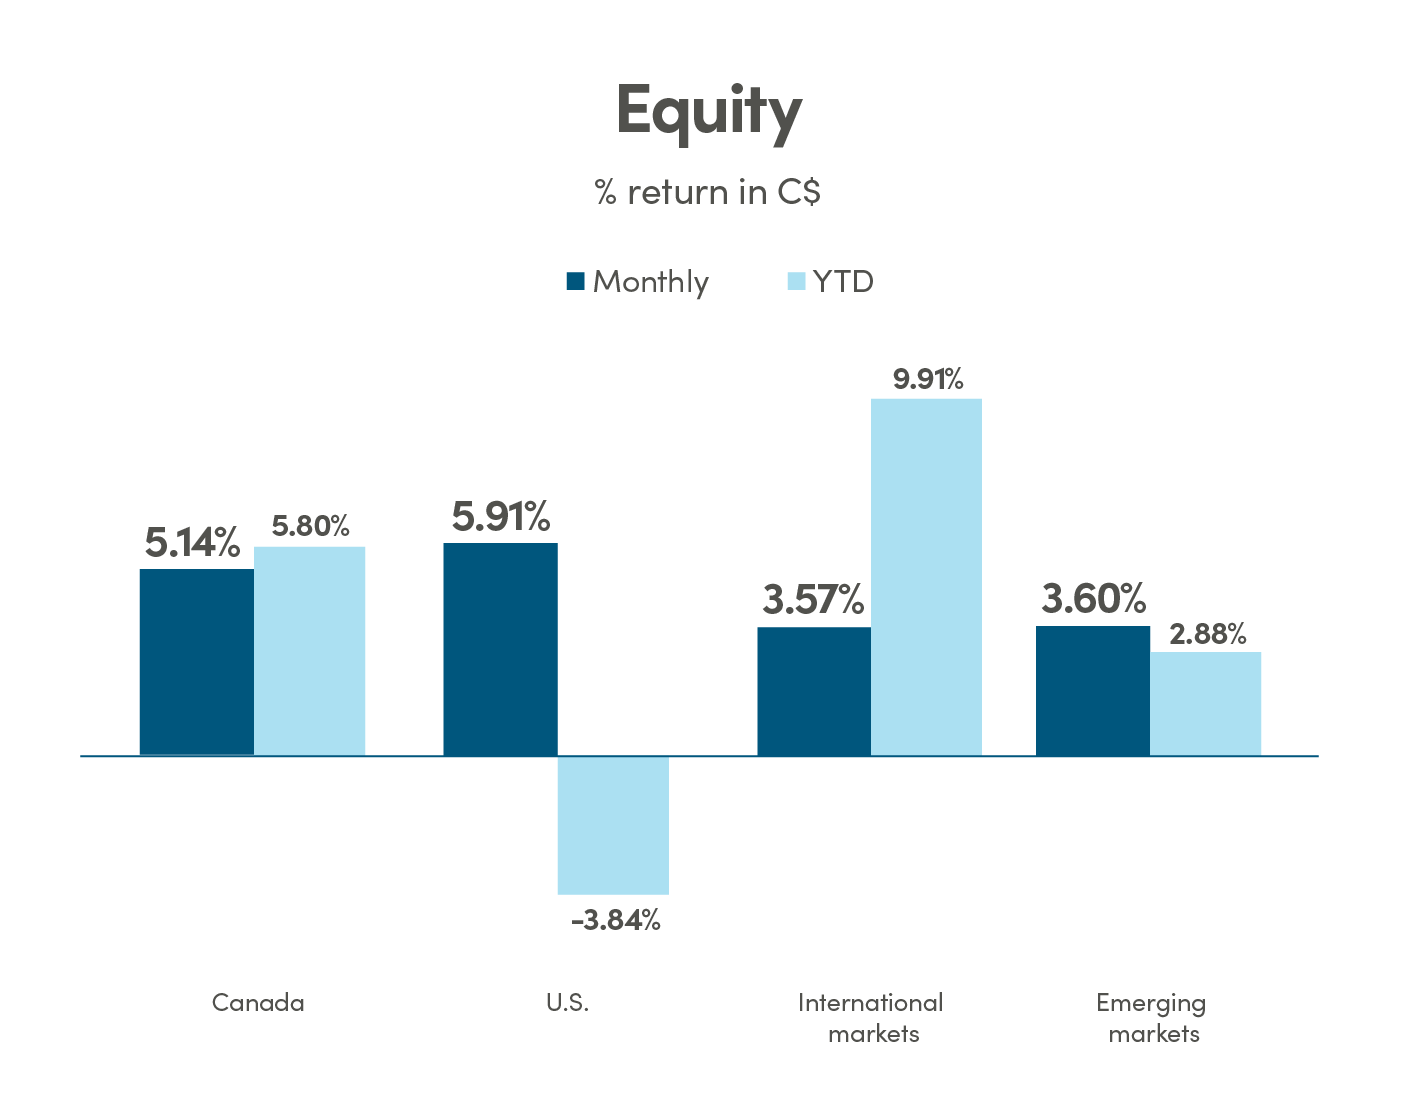
Canada: MSCI Canada Index TR; U.S.: MSCI USA Index TR International: MSCI EAFE Index TR; Emerging markets: MSCI Emerging Markets Index TR.
Source: Morningstar Direct.
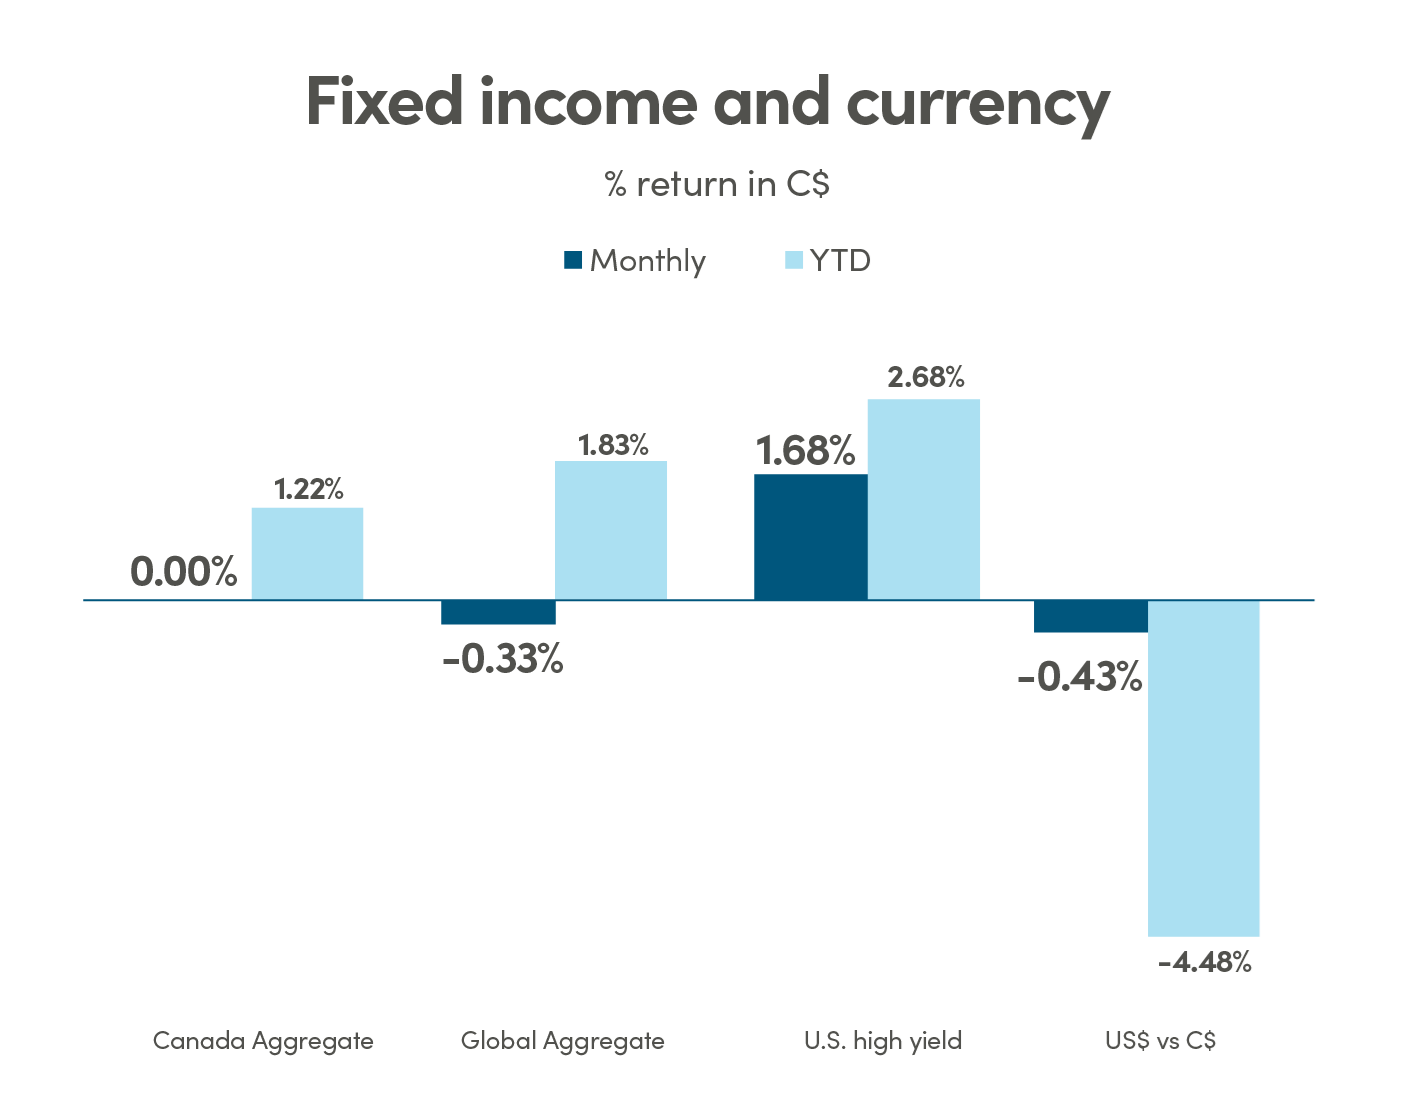
Canada Aggregate: Bloomberg Barclays Canada Aggregate Bond Index; Global Aggregate: Bloomberg Barclays Global Aggregate Bond Index; U.S. High Yield: Bloomberg Barclays U.S. High Yield Index.
Source: Morningstar Direct.
Equity rebound: relief rally, or out of the woods?
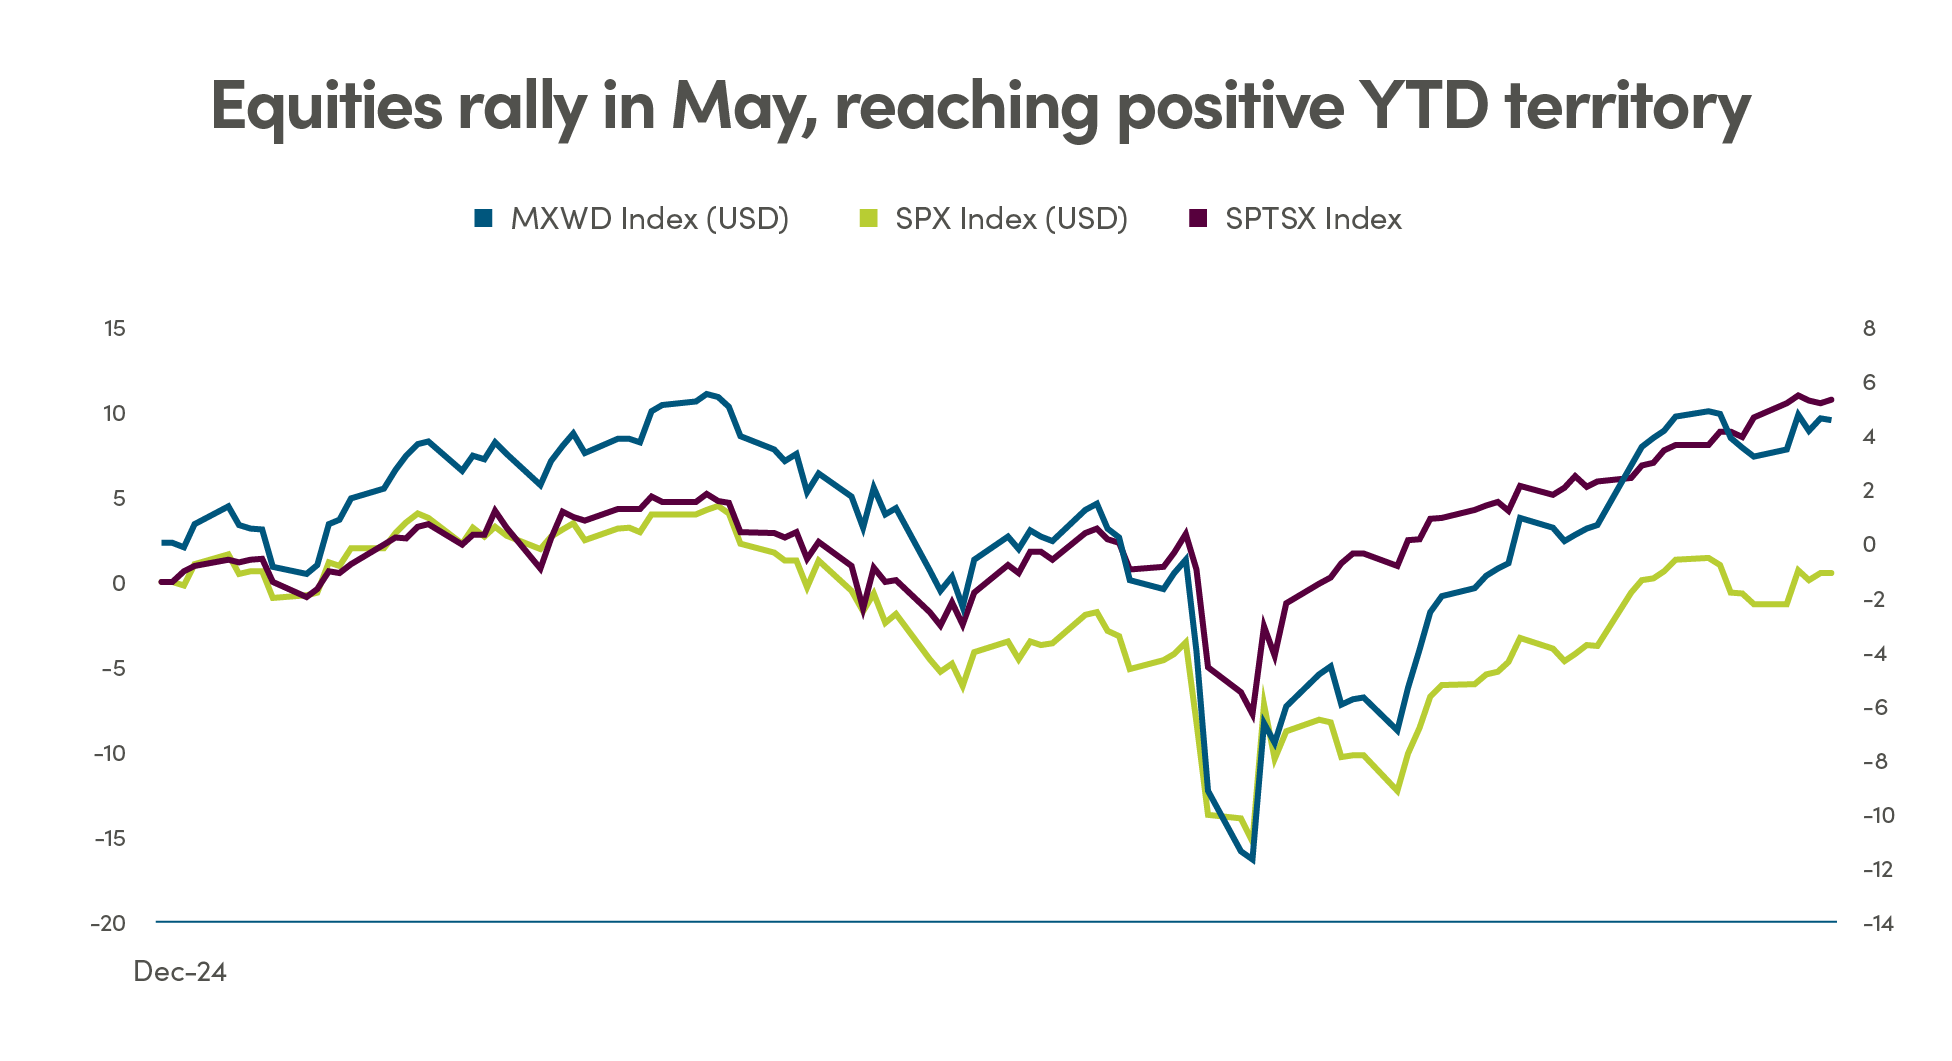
Global equities extended gains in May, driven by the 90-day tariff truce with China, announced May 9, which paused escalatory U.S. tariffs while maintaining duties on Chinese goods. Markets have grown less reactive to President Trump’s tariff rhetoric, with EU tariff talks eliciting only modest volatility, suggesting investors are pricing in temporary pauses as part of Trump’s predictable playbook. The MSCI World Index rose 2.3% in May, led by U.S. and Canadian technology sectors.
Corporate earnings underscored resilience, with FactSet reporting that only 3% of S&P 500 companies (8 out of 259) withdrew or failed to update 2025 EPS guidance during Q1 earnings, citing tariff uncertainty. Of the 251 companies providing guidance, 139 maintained prior outlooks, 64 raised guidance, and 37 lowered it, reflecting conservative forecasts and effective tariff mitigation strategies. The AI theme remained a key driver, with companies like NVIDIA and Canadian AI firms posting strong results, though some pulled guidance due to trade risks. Absent tariff uncertainty, analysts suggest many firms would have raised one-year outlooks, highlighting underlying strength.
Central banks maintained cautious stances. The Fed paused rate cuts, citing tariff-driven inflation risks, while the BoC emphasized Canada’s exposure to U.S. trade policies, projecting inflation could exceed 3% by mid-2026 if tariffs resume. Consumer confidence improved slightly, but business sentiment remained cautious amid supply chain concerns.
Bottom line: The equity rally reflects tactical relief, but sustained trade uncertainty warrants diversified portfolios with exposure to resilient sectors like AI and technology.
Source: FactSet https://insight.factset.com/few-sp-500-companies-have-withdrawn-eps-guidance-for-2025, Bloomberg.
Source: Bloomberg.
Source: IMF
Bond market update: U.S. exceptionalism in question?
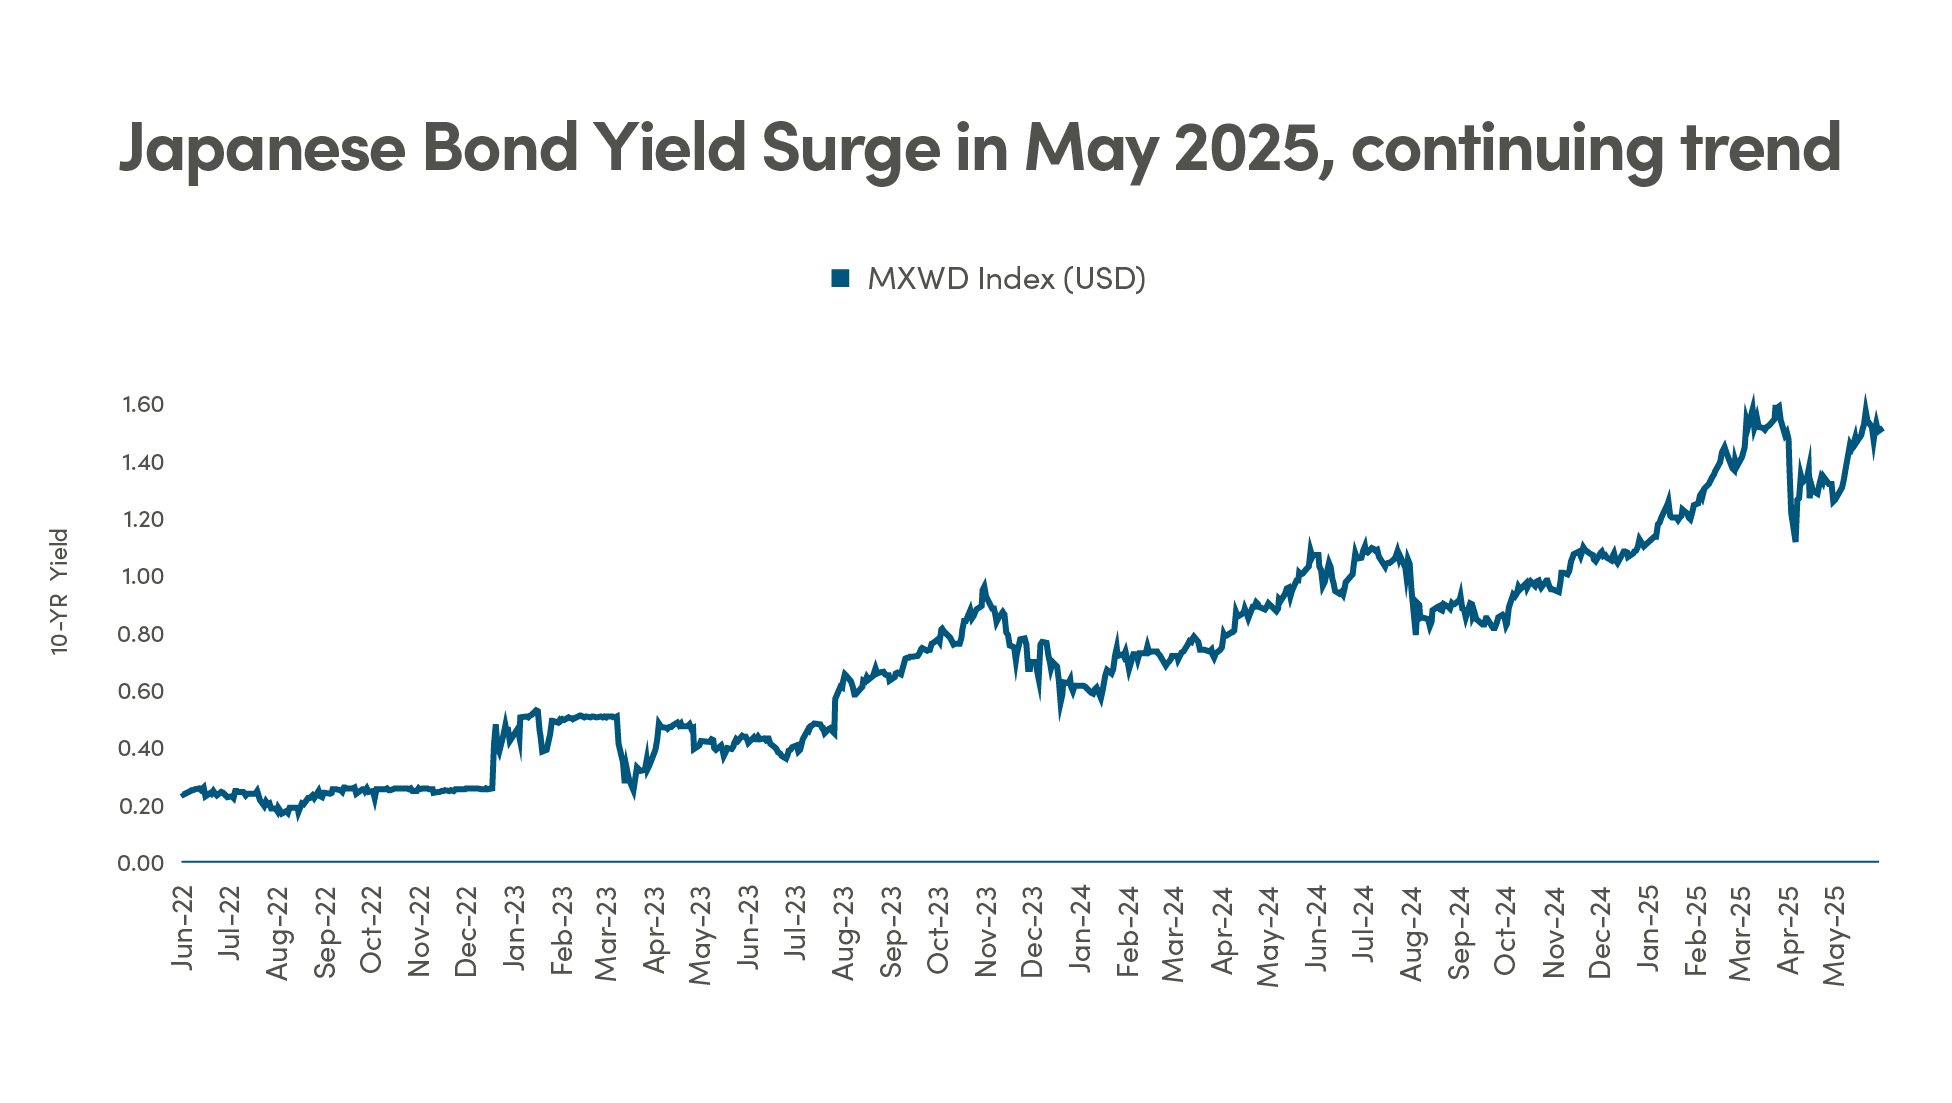
The U.S. Treasury market faced scrutiny in May as investors explored non-U.S. safe-haven options amid surging Japanese bond yields. U.S. 10-year Treasury yields stabilized at elevated levels, but Japan’s 10-year JGB yields spiked to 1.57%, a decade high, driven by Bank of Japan (BoJ) signals of tighter policy and reduced bond purchases. This shift fueled speculation of a continued yen carry trade unwind, as investors who borrowed in low-yield yen to invest in higher-yield assets faced rising costs.
Non-U.S. treasury markets, including Germany’s bunds and Canada’s bonds, lack the liquidity and depth to supplant U.S. Treasuries as the global safe-haven. However, gold rose to $3,600/oz, and safe-haven currencies like the Japanese yen and Swiss franc gained 1.5% and 1.2% against the U.S. dollar, respectively, reflecting diversification away from U.S. assets. The DXY index dipped 0.8%, pressured by tariff pauses and U.S. fiscal deficit concerns. The ECB’s dovish stance, with rates at 2.25%, supported the euro, while the BoJ’s hawkish tilt bolstered the yen.
The potential unwind of the yen carry trade poses risks to global bond markets, as repatriated capital could further elevate Japanese yields and reduce demand for higher yielding U.S. assets. Investors are increasingly hedging against U.S. policy uncertainty, including fears of Fed independence erosion following Trump’s ongoing criticism of Fed Chair Powell.
Bottom line: Diversifying into gold, yen, or other safe-haven assets can mitigate risks from shifting yield dynamics and U.S.-centric uncertainties.
Source: Bloomberg
Trump’s tax plan unveiled: opportunities and risks
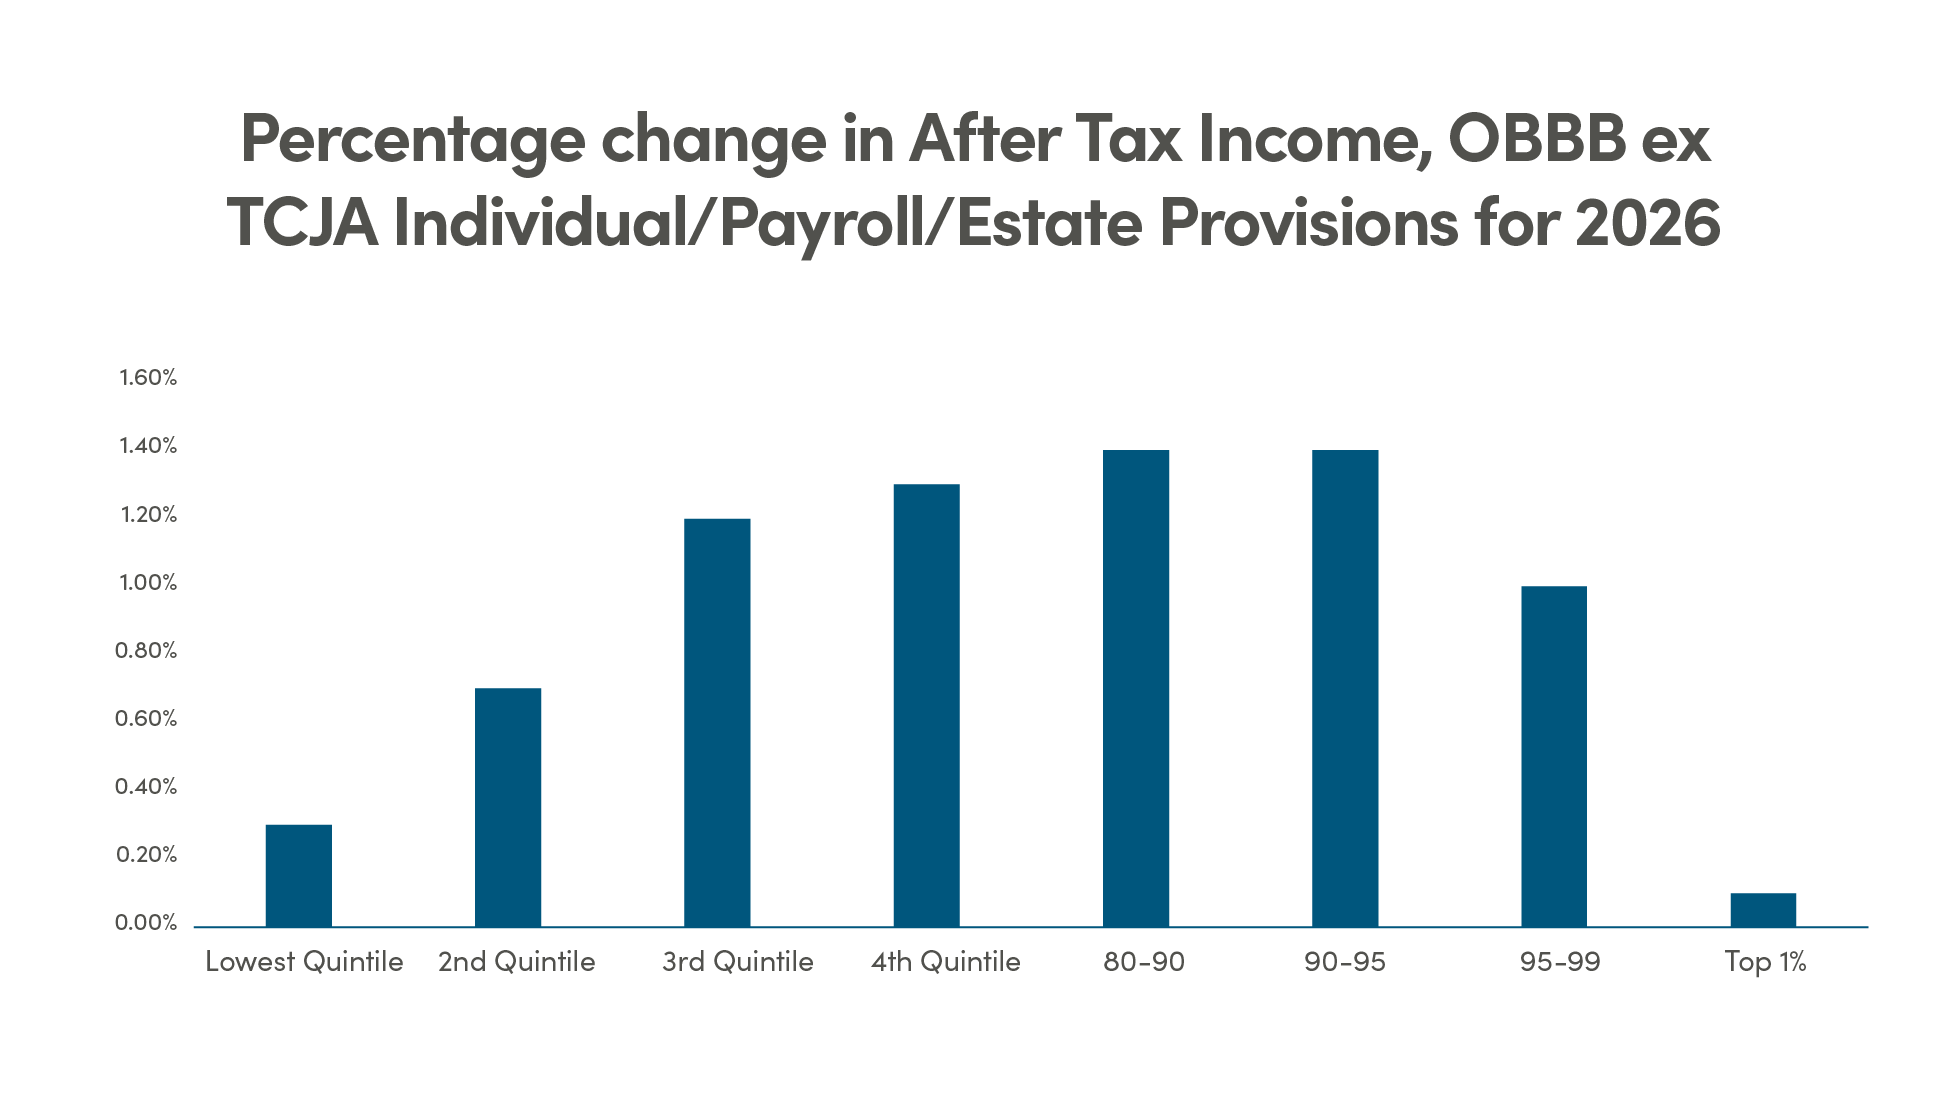
President Trump’s tax plan, unveiled in May 2025, proposes reducing the corporate tax rate from 21% to 15%, extending 2017 individual tax cuts, and introducing new deductions for small businesses. It also includes a controversial 10% tax credit for U.S.-based manufacturing, offset by higher tariffs on imports, aiming to boost domestic production. The plan drew polarized reactions: supporters argue it will spur growth, while critics, including some Republicans, warn of ballooning deficits, with the Congressional Budget Office estimating an additional $2 trillion in debt over a decade.
This new tax plan, "The One Big Beautiful Bill" (H.R. 1), passed the House on May 22, 2025, and awaits Senate approval, projecting $3.8–$4.9 trillion in added deficits between 2025–2034. Key measures include corporate tax cuts, extended individual tax relief, and tariff-funded manufacturing credits, sparking mixed reactions. U.S. manufacturing and energy stocks rose 1-2%, but bond yields ticked higher on inflation fears. The plan’s tariff reliance could raise consumer prices, impacting Canadian exports (75%to the U.S.), with the BoC warning of inflation risks above 3% by mid-2026. Key provisions include:
- Corporate tax cut: Reduces rate from 21% to 15%, boosting small-cap and industrial stocks
- Individual tax extensions: Permanently extends 2017 TCJA rates and raises standard deductions ($400 single, $800 joint)
- Manufacturing credits: 10% credit for U.S. production, funded by tariffs, risking trade tensions
- SALT cap adjustment: Raises cap to $40,000 for some, phasing down for high earners
- Targeted relief: Eliminates taxes on tips, overtime pay and offers a $2,500 child tax credit
Markets reacted cautiously, with U.S. equity sectors like manufacturing and energy gaining 1-2%, while bond yields ticked higher on inflation fears. The plan’s reliance on tariff revenue to fund tax cuts raised concerns about cost pass-throughs to consumers, potentially pushing U.S. inflation above the Fed’s 2% target. In Canada, the BoC noted risks to export-driven sectors, given 75% of Canadian exports go to the U.S.
Bottom line: The tax plan offers selective opportunities in U.S. equities but requires vigilance on inflation and fiscal risks. Flexible asset allocation remains critical.
Source: Bloomberg, Congressional Budget Office
Source: Bloomberg

Legal
Aviso Wealth Inc. (“Aviso”) is the parent company of Aviso Financial Inc. (“AFI”) and Northwest & Ethical Investments L.P. (“NEI”). Aviso and Aviso Wealth are registered trademarks owned by Aviso Wealth Inc. NEI Investments is a registered trademark of NEI. Any use by AFI or NEI of an Aviso trade name or trademark is made with the consent and/or license of Aviso Wealth Inc. Aviso is a wholly-owned subsidiary of Aviso Wealth LP, which in turn is owned 50% by Desjardins Financial Holding Inc. and 50% by a limited partnership owned by the five Provincial Credit Union Centrals and The CUMIS Group Limited.
This material is for informational and educational purposes and it is not intended to provide specific advice including, without limitation, investment, financial, tax or similar matters. This document is published by AFI and unless indicated otherwise, all views expressed in this document are those of AFI. The views expressed herein are subject to change without notice as markets change over time. Views expressed regarding a particular industry or market sector should not be considered an indication of trading intent of any funds managed by NEI Investments. Forward-looking statements are not guaranteed of future performance and risks and uncertainties often cause actual results to differ materially from forward-looking information or expectations. Do not place undue reliance on forward-looking information. Mutual funds and other securities are offered through Aviso Financial Inc. Commissions, trailing commissions, management fees and expenses all may be associated with mutual fund investments. Please read the prospectus before investing. Unless otherwise stated, mutual fund securities and cash balances are not insured nor guaranteed, their values change frequently and past performance may not be repeated.
The MSCI information may only be used for your internal use, may not be reproduced or re-disseminated in any form and may not be used as a basis for or a component of any financial instruments or products or indices. None of the MSCI information is intended to constitute investment advice or a recommendation to make (or refrain from making) any kind of investment decision and may not be relied on as such. Historical data and analysis should not be taken as an indication or guarantee of any future performance, analysis, forecast or prediction. The MSCI information is provided on an “as is” basis and the user of this information assumes the entire risk of any use made of this information. MSCI, each of its affiliates and each other person involved in or related to computing, computing or creating any MCI information (collectively, the “MSCI Parties”) expressly disclaims all warranties (including, without limitation, any warranties of originality, accuracy, completeness, timeliness, non-infringement, merchantability and fitness for a particular purpose) with respect to this information. Without limiting any of the foregoing, in no event shall any MSCI Party have any liability for any direct, indirect, special, incidental, punitive, consequential (including, without limitation, lost profits) or any other damages.
©2025 Morningstar. All Rights Reserved. The information contained herein: (1) is proprietary to Morningstar Research Services LLC, Morningstar, Inc. and/or their content providers; (2) may not be copied or distributed; and (3) is not warranted to be accurate, complete or timely. Neither Morningstar Research Services, Morningstar nor their content providers are responsible for any damages or losses arising from any use of this information. Access to or use of the information contained herein does not establish an advisory or fiduciary relationship with Morningstar Research Services, Morningstar, Inc. or their content providers. Past performance is no guarantee of future results.
