May 2025 Monthly Market Insights
May Monthly Market Insights
Data and opinions as of April 30, 2025
Tariff pause, dollar dynamics and Canada’s new path
April 2025 was marked by a fragile pause in escalating U.S. tariff policies, a reassessment of the U.S. dollar’s dominance, and a transformative election in Canada. The 90-day tariff suspension, announced after Liberation Day celebrations, provided temporary relief to global markets but failed to dispel concerns overtrade tensions and slowing economic growth. Meanwhile, the U.S. dollar faced pressure as the yields vs. dollar spread diverged, and investors questioned its safe-haven status. In Canada, Prime Minister Mark Carney’s victory and ambitious growth plan sparked optimism for productivity-driven prosperity, though tariff risks loom large. Central banks, including the U.S. Federal Reserve (Fed), European Central Bank (ECB), Bank of England (BoE), and Bank of Canada (BoC), remained focused on balancing inflation and growth, with divergent policies reflecting regional challenges.
NEI perspectives
Tariff uncertainty reshapes global growth: The temporary 90-day pause on U.S. tariffs, offers a brief reprieve but does not alter the broader trajectory of slowing global growth. Bottom line: Investors should remain cautious, prioritizing diversified portfolios to navigate heightened trade and policy uncertainty.
U.S. dollar under scrutiny: The U.S. dollar’s strength is wavering amid tariff pauses and shifting yield spreads, with implications for global currency markets and asset allocation. Bottom line: Currency volatility underscores the need for hedged exposures and selective safe-haven diversifiers.
Canada’s policy pivot: Canada’s new leadership under Prime Minister Mark Carney signals a bold growth agenda focused on AI, clean energy, and housing, despite tariff-related risks. Bottom line: Canadian equities may see renewed interest, particularly in technology and renewable energy sectors, as long-term productivity investments take shape.
‒NEI Asset Allocation team
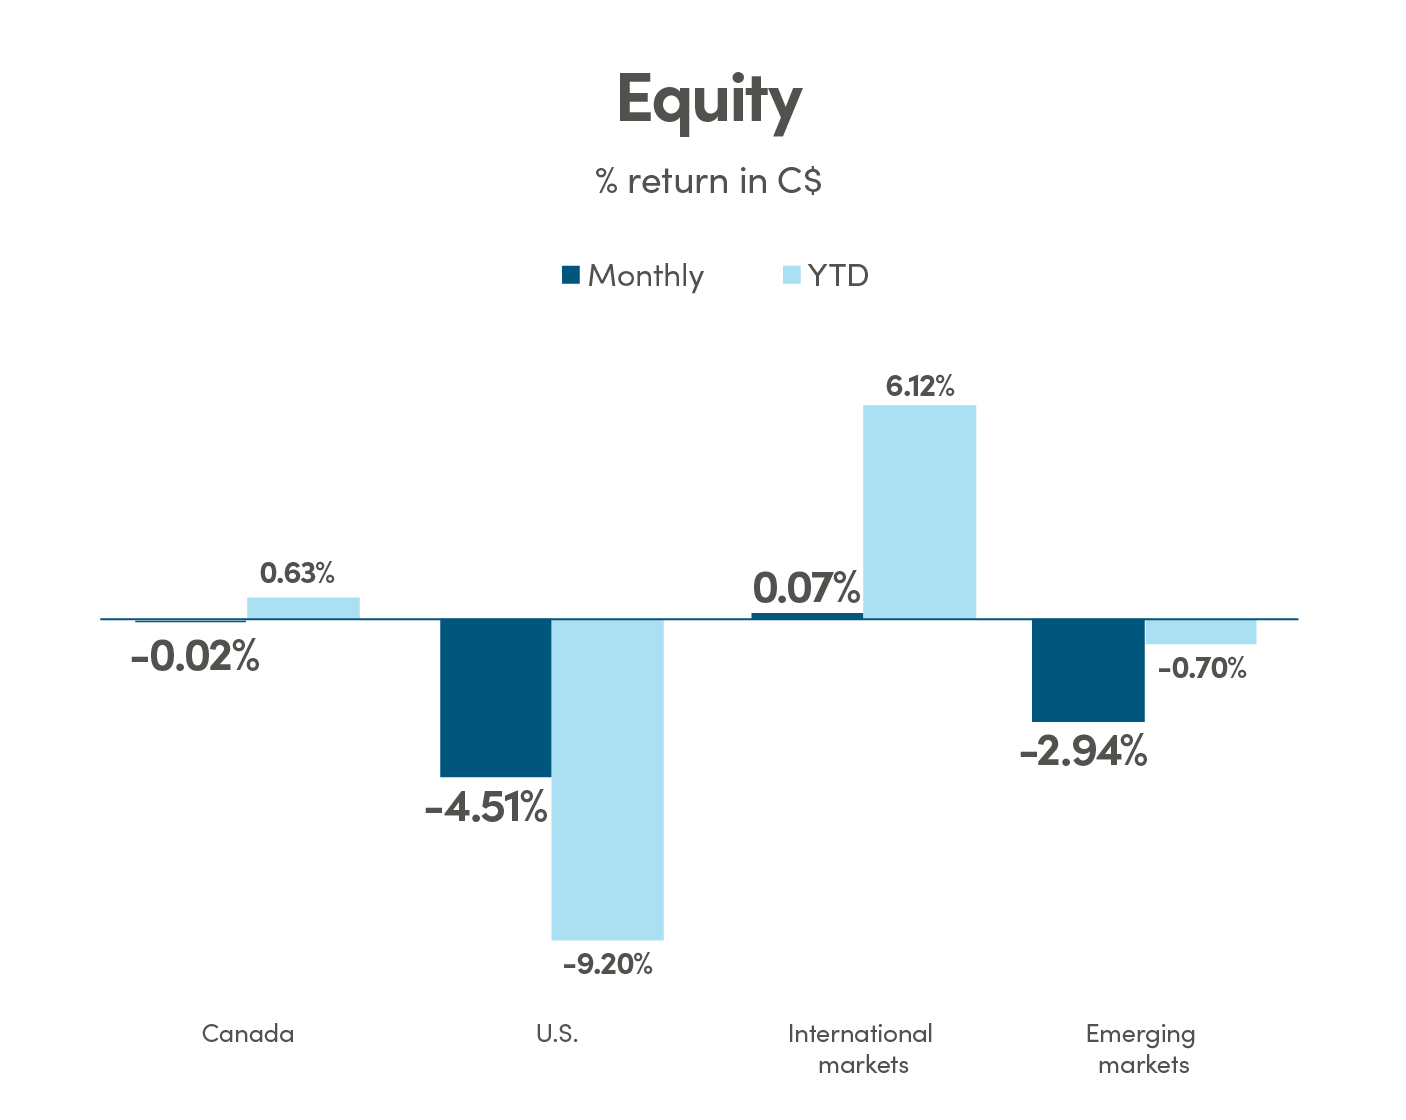
Canada: MSCI Canada Index TR; U.S.: MSCI USA Index TR International: MSCI EAFE Index TR; Emerging markets: MSCI Emerging Markets Index TR.
Source: Morningstar Direct
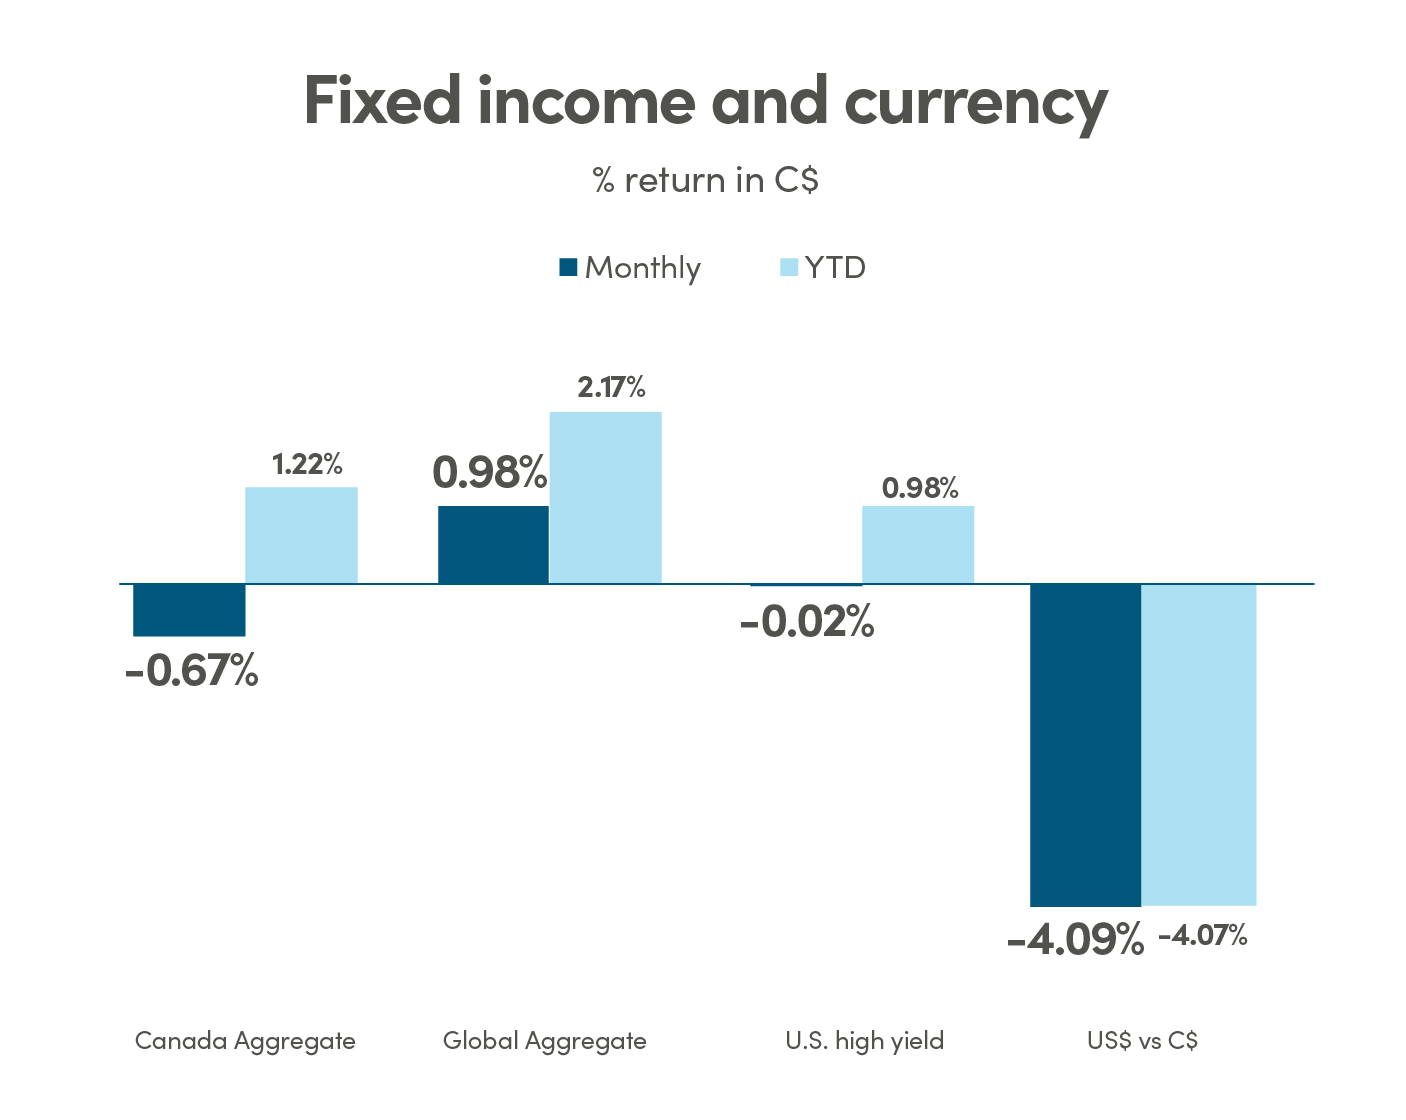
Canada Aggregate: Bloomberg Barclays Canada Aggregate Bond Index; Global Aggregate: Bloomberg Barclays Global Aggregate Bond Index; U.S. High Yield: Bloomberg Barclays U.S. High Yield Index.
Source: Morningstar Direct
Tariff pause tempers global growth concerns
The global economy faces a critical juncture as trade tensions and policy uncertainty intensify. The International Monetary Fund’s (IMF) April 2025 World Economic Outlook projects global growth at 2.8% in 2025, down 0.8 percentage points from its January forecasts. This is driven by tariff impacts and supply chain disruptions. The 90-day tariff pause temporarily halted most U.S.tariffs while maintaining elevated duties on China, offering markets a brief respite. However, the IMF warns that sustained trade tensions could further depress growth, with global trade growth projected at just 1.7% in 2025.
Consumer and business confidence indicators reflected caution, while market-based indicators like breakeven inflation rates edged higher. Tariff-related supply shocks continue to pressure prices, particularly in energy and intermediate goods, complicating central bank efforts to normalize monetary policy.
Central bank responses varied. The Fed signaled vigilance on inflation, pausing rate cuts; the ECB and BoE maintained cautious stances, citing trade risks; and the BoC, under Canada’s new economic context, balanced growth stimulus with inflation concerns. The BoC warned that prolonged U.S. tariffs could push Canadian inflation above 3% by mid-2026, risking a deep recession.
Bottom line: The tariff pause offers a tactical window for investors to reassess exposures. Diversification across regions and asset classes, including inflation-hedging strategies, remains critical amid persistent downside risks.
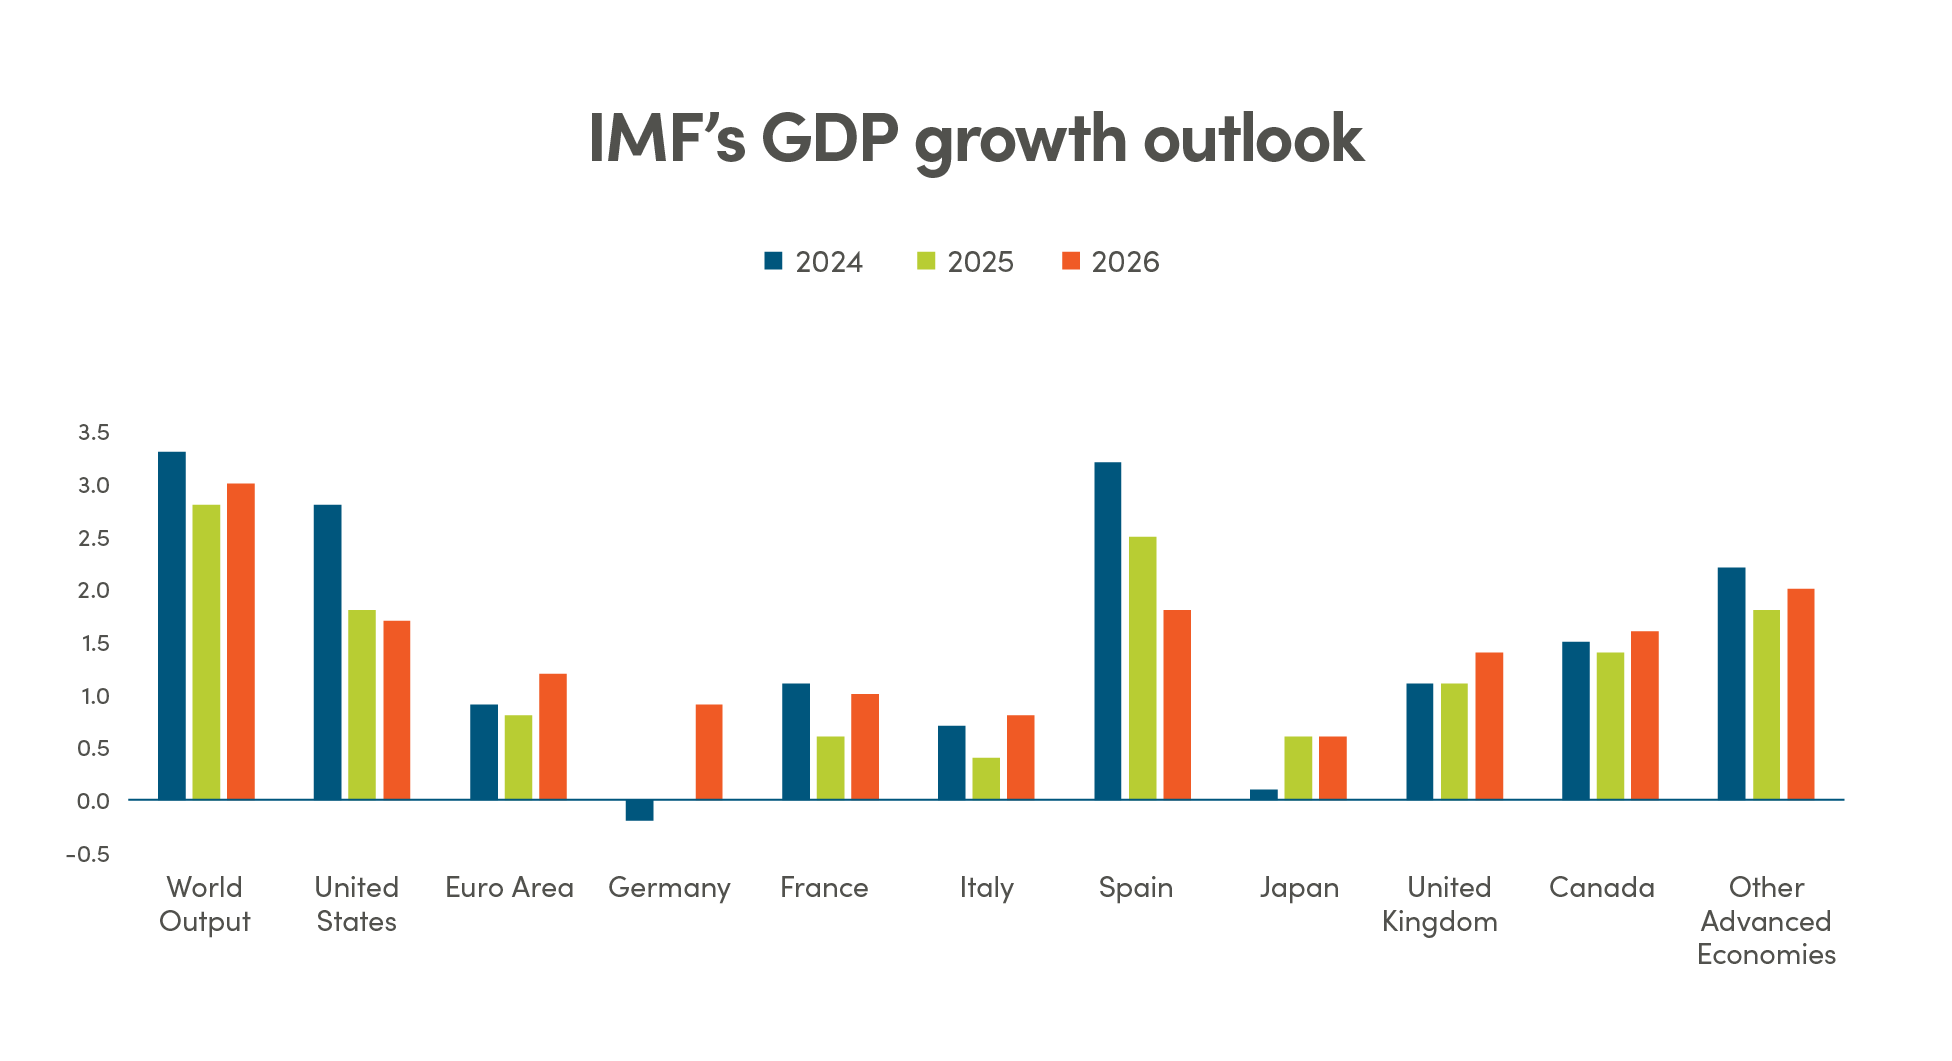
Source: IMF
U.S. dollar’s strength in question
The U.S. dollar’s role as a global safe-haven faced scrutiny in April as central banks diversified reserves, with other safe-haven assets like gold continuing to gain traction. Despite a resilient U.S. economy, the DXY index fell 1% to a three-year low, pressured by trade policy uncertainty and a sell-off in U.S. assets. U.S. 10-year Treasury yields rose, widening spreads against G7 counterparts like Germany and Japan, which supported the dollar’s relative strength. However, the euro strengthened post-ECB rate cut, reflecting tariff-related eurozone optimism.
Gold surged to $3,500/oz, driven by safe-haven demand, central bank buying, and its role as a hedge against dollar volatility. Safe-haven currencies like the Japanese yen and Swiss franc also saw inflows, with investors hedging against U.S. policy risks and stagflation fears. The ECB’s rate cut to 2.25% and dovish outlook weakened the euro’s yield advantage, but trade deal hopes supported it.
The dollar’s safe-haven status was further tested by political uncertainty, including President Trump’s criticism of Fed Chair Powell, raising fears of the erosion of the Fed’s independence. With U.S. fiscal deficits and tariff risks in focus, investors rotated toward gold and non-dollar currencies, though widened yield spreads tempered dollar declines.
Bottom line: Gold and safe-haven currencies like the yen and franc offer diversification as the dollar faces structural pressures. Investors should consider hedged exposures to mitigate volatility.
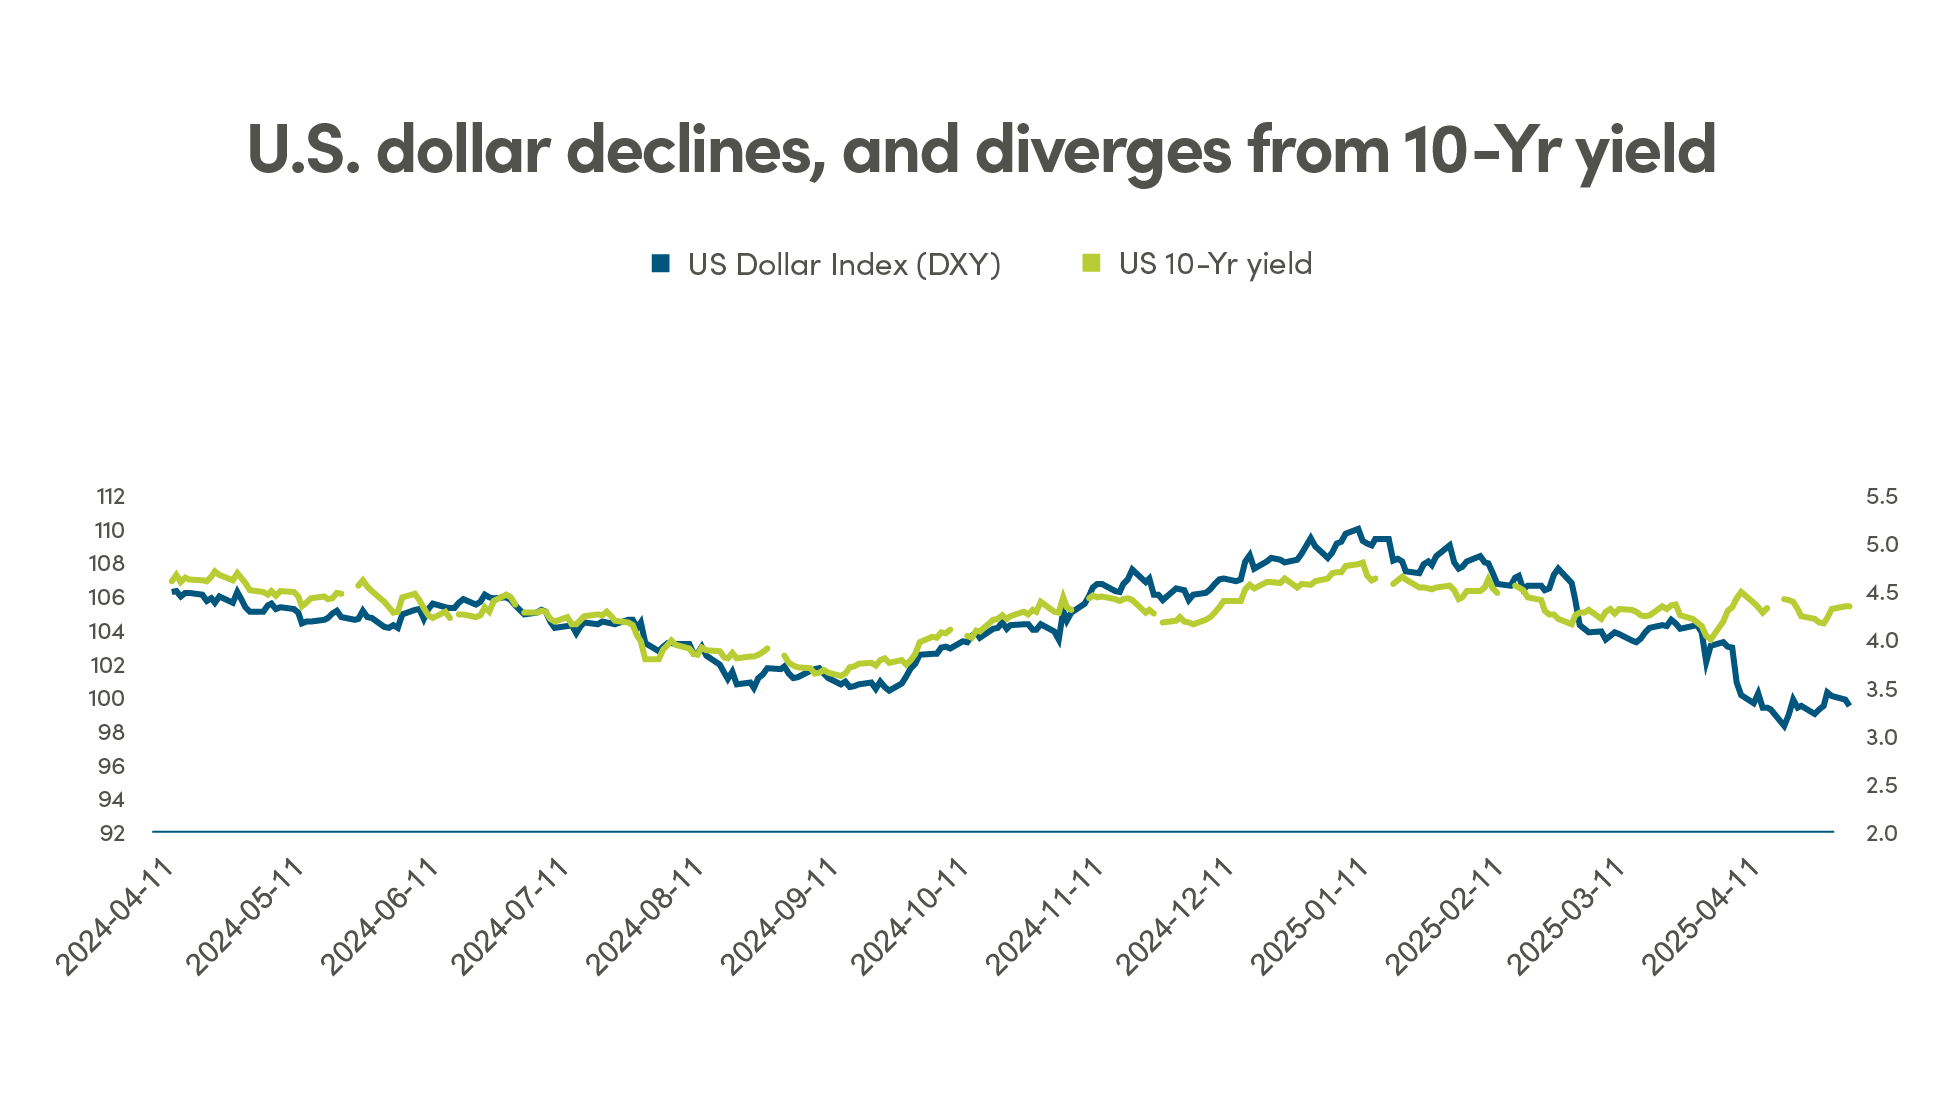
Source: Bloomberg
Canada’s strategic reset: Carney’s growth agenda
Canada’s equity markets outperformed in April, driven by Prime Minister Mark Carney’s election victory and a forward-looking growth plan. Carney’s platform, emphasizing AI infrastructure, clean energy, and housing, aims to address Canada’s productivity lag, which has seen Canadian workers trail U.S. counterparts by 33% in output efficiency. His “Made in Canada” strategy focuses on four pillars: smarter (AI-driven productivity), cleaner(integrated energy leadership), more resilient (economic diversification), and fairer (inclusive prosperity).
The TSX index rallied, with technology, renewable energy, and real estate sectors leading gains. Carney’s commitment to 500,000 new homes annually, prioritizing affordable prefabricated units, boosted construction and banking stocks. His trade diversification strategy, targeting Europe and Asia to reduce reliance on the U.S.(75% of exports), resonated with investors, though tariff uncertainty remains a headwind.
Carney’s policies include fiscal stimulus via AI R&D, clean energy projects, and STEM education, potentially limiting BoC rate cuts. NEI’s engagement with energy companies on methane emissions and responsible mining aligns with Carney’s sustainability focus, supporting long-term investor value. However, the BoC flagged tariff risks, projecting a potential recession if U.S. tariffs persist.
Bottom line: Canada’s policy shift offers opportunities in technology, clean energy, and housing-related equities. Investors should balance optimism with caution, favoring diversified portfolios to mitigate tariff and inflation risks.
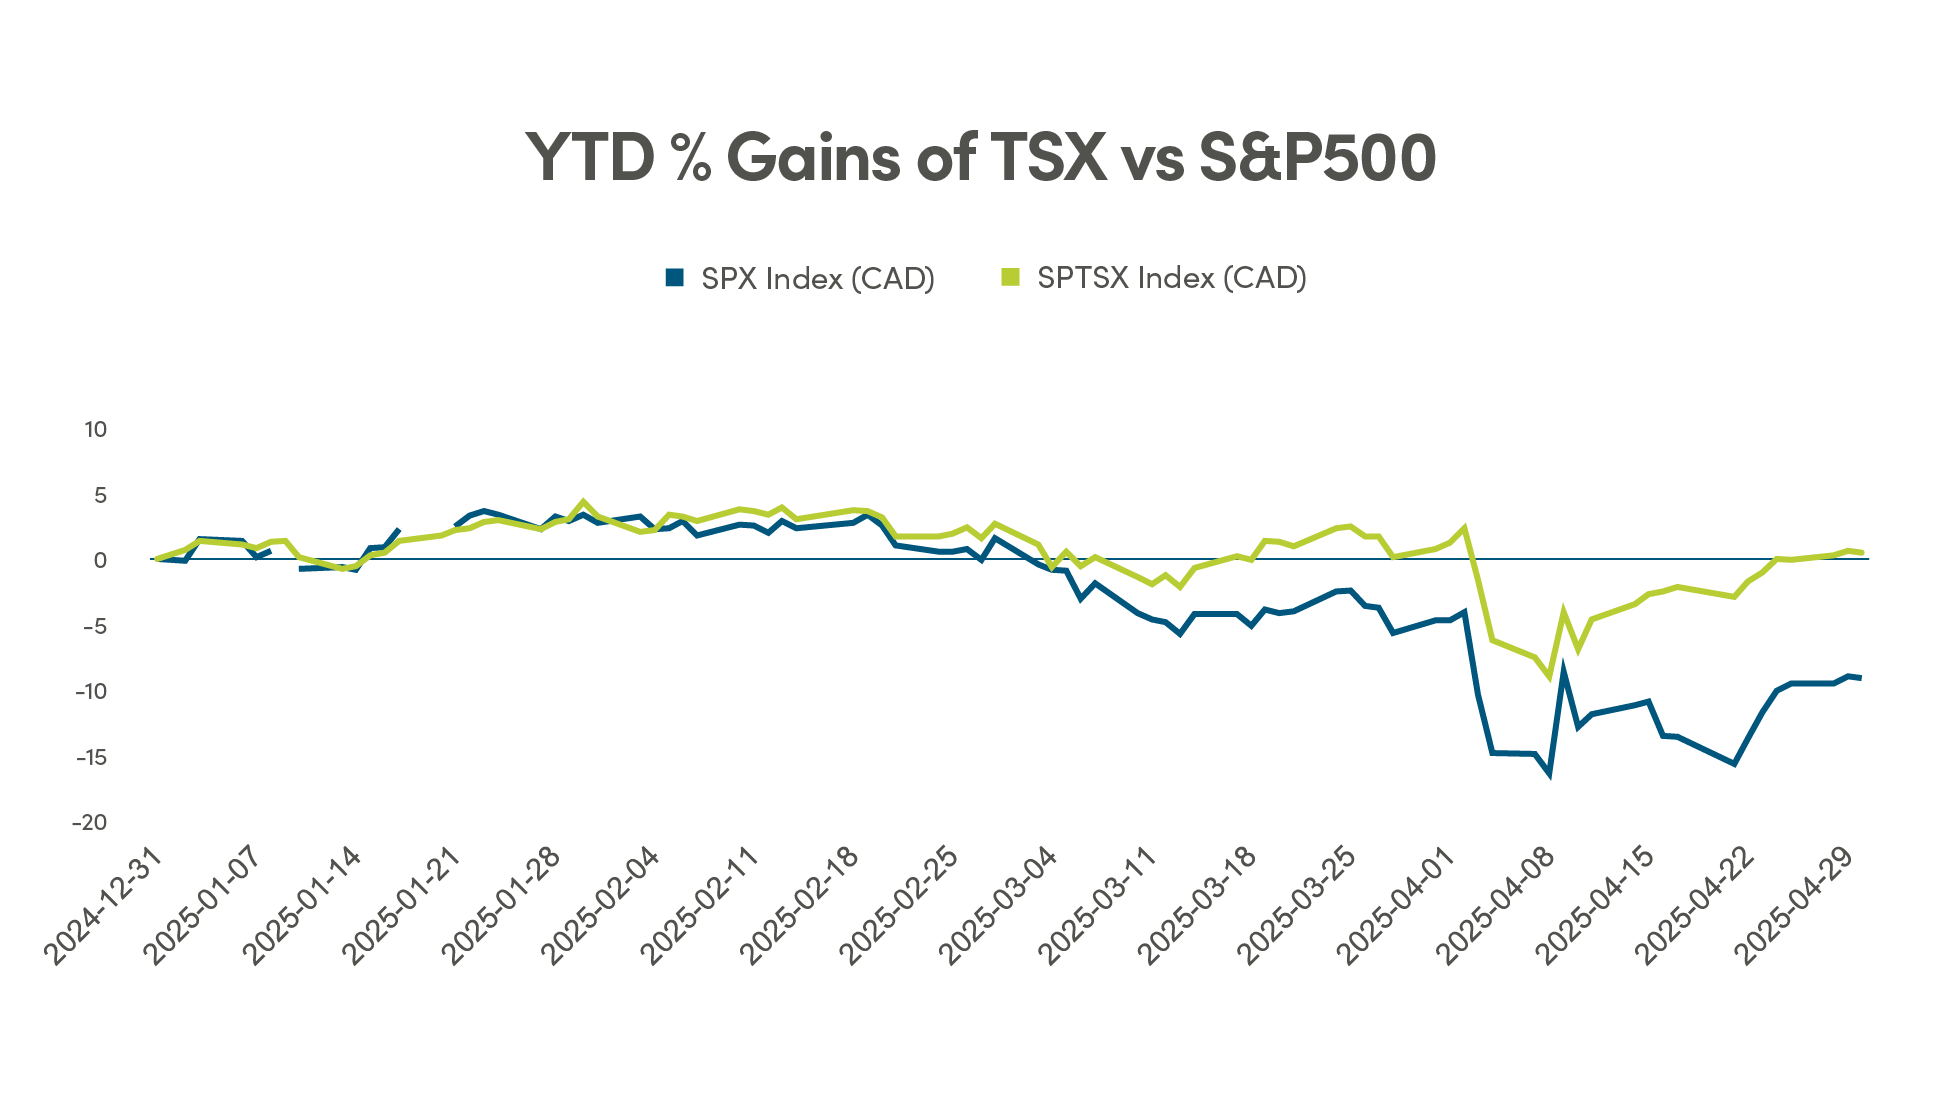
Source: Bloomberg, StatisticsCanada

Legal
Aviso Wealth Inc. (“Aviso”) is the parent company of Aviso Financial Inc. (“AFI”) and Northwest & Ethical Investments L.P. (“NEI”). Aviso and Aviso Wealth are registered trademarks owned by Aviso Wealth Inc. NEI Investments is a registered trademark of NEI. Any use by AFI or NEI of an Aviso trade name or trademark is made with the consent and/or license of Aviso Wealth Inc. Aviso is a wholly-owned subsidiary of Aviso Wealth LP, which in turn is owned 50% by Desjardins Financial Holding Inc. and 50% by a limited partnership owned by the five Provincial Credit Union Centrals and The CUMIS Group Limited.
This material is for informational and educational purposes and it is not intended to provide specific advice including, without limitation, investment, financial, tax or similar matters. This document is published by AFI and unless indicated otherwise, all views expressed in this document are those of AFI. The views expressed herein are subject to change without notice as markets change over time. Views expressed regarding a particular industry or market sector should not be considered an indication of trading intent of any funds managed by NEI Investments. Forward-looking statements are not guaranteed of future performance and risks and uncertainties often cause actual results to differ materially from forward-looking information or expectations. Do not place undue reliance on forward-looking information. Mutual funds and other securities are offered through Aviso Financial Inc. Commissions, trailing commissions, management fees and expenses all may be associated with mutual fund investments. Please read the prospectus before investing. Unless otherwise stated, mutual fund securities and cash balances are not insured nor guaranteed, their values change frequently and past performance may not be repeated.
The MSCI information may only be used for your internal use, may not be reproduced or re-disseminated in any form and may not be used as a basis for or a component of any financial instruments or products or indices. None of the MSCI information is intended to constitute investment advice or a recommendation to make (or refrain from making) any kind of investment decision and may not be relied on as such. Historical data and analysis should not be taken as an indication or guarantee of any future performance, analysis, forecast or prediction. The MSCI information is provided on an “as is” basis and the user of this information assumes the entire risk of any use made of this information. MSCI, each of its affiliates and each other person involved in or related to computing, computing or creating any MCI information (collectively, the “MSCI Parties”) expressly disclaims all warranties (including, without limitation, any warranties of originality, accuracy, completeness, timeliness, non-infringement, merchantability and fitness for a particular purpose) with respect to this information. Without limiting any of the foregoing, in no event shall any MSCI Party have any liability for any direct, indirect, special, incidental, punitive, consequential (including, without limitation, lost profits) or any other damages.
©2025 Morningstar. All Rights Reserved. The information contained herein: (1) is proprietary to Morningstar Research Services LLC, Morningstar, Inc. and/or their content providers; (2) may not be copied or distributed; and (3) is not warranted to be accurate, complete or timely. Neither Morningstar Research Services, Morningstar nor their content providers are responsible for any damages or losses arising from any use of this information. Access to or use of the information contained herein does not establish an advisory or fiduciary relationship with Morningstar Research Services, Morningstar, Inc. or their content providers. Past performance is no guarantee of future results.