March 2024 Monthly Market Insights
Data and opinions as of February 29, 2024
Markets leap forward in February
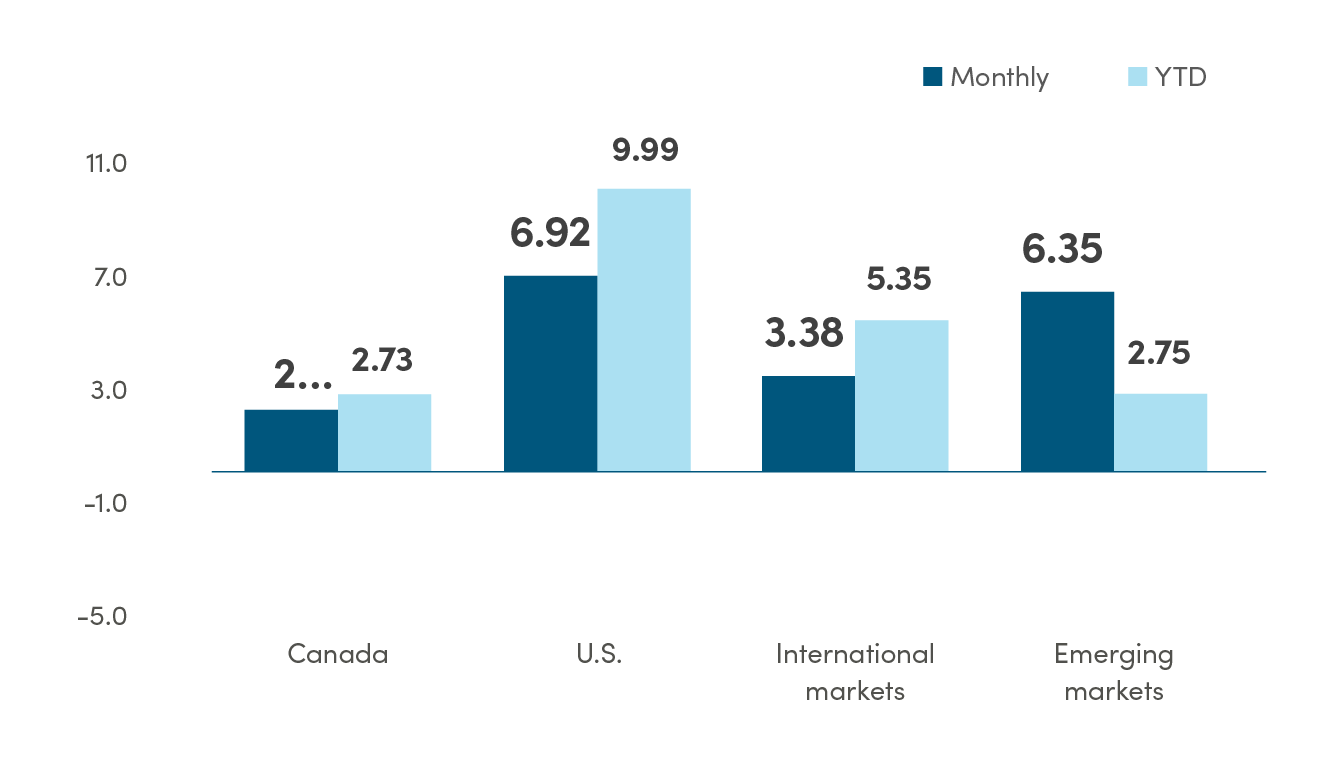
The market rally continued into February in equities, with resilient economic data and relatively strong earnings reports fueling the S&P 500 Index to new record highs in February, gaining 6.9% for the month. Both the Nasdaq and S&P 500 Index had their best February since 2015. The Japanese market also continued to rally, with the Nikkei 225 Index reaching a new all-time high for the first time in over 30 years. Canada also had some encouraging news on the inflation front, helping the TSX rise by 2.2% in February.
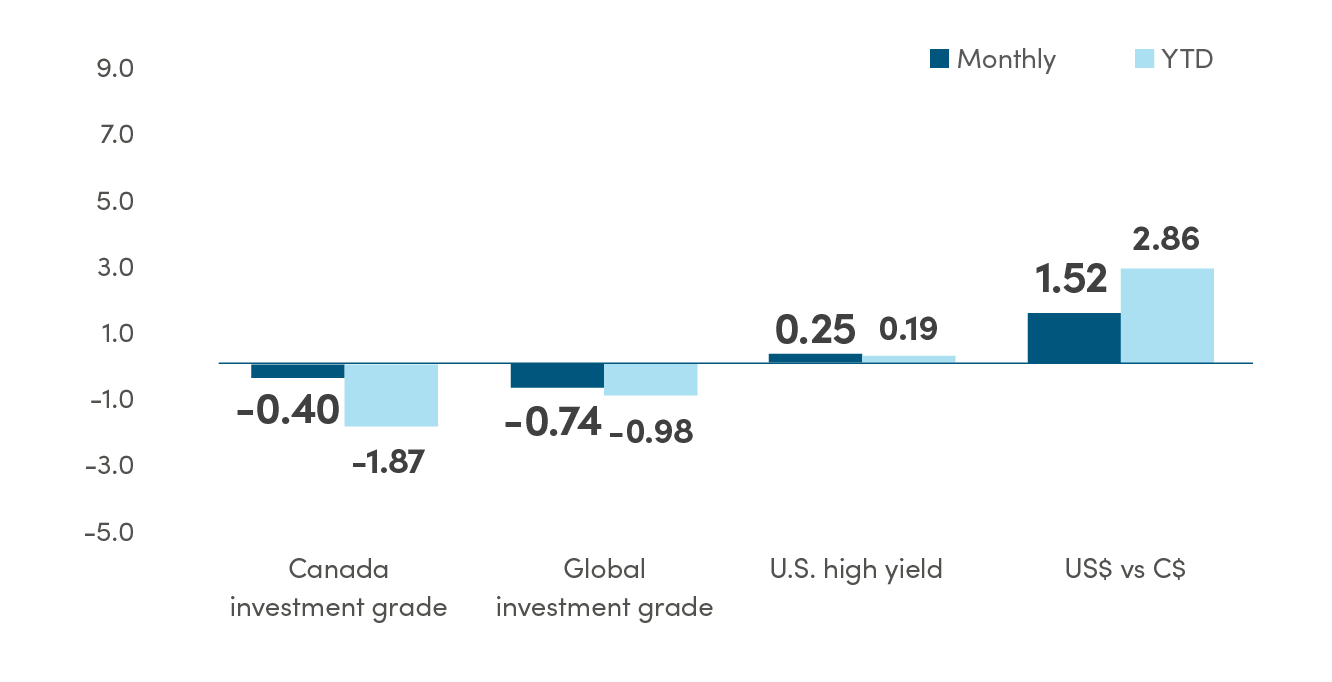
By contrast, fixed income markets were broadly lower, with the Bloomberg Global Aggregate index losing -0.74% in February, as the overly ambitious expectations for rate cuts were pared back, causing yields to rise in response.
The NEI perspective
Rate cut expectations have been pared back despite global inflation continue to moderate. Many market participants that originally assumed aggressive rate cutting throughout the year have had to reign in their expectations, though the timeline for the first rate cuts are differing by region.
Strong macro environment is providing support for U.S. equities in the near term as the U.S. economy continues to outshine its developed peers with a strong GDP forecast for the year. The combination of falling inflation and rising economic output is positive for risk assets generally.
Small caps have lagged over the last few years due to their increasing debt services costs in a higher rate environment. However, small caps are now trading at attractive valuations with a wide discount to large caps that could provide an attractive entry point for high quality names when rates begin to fall.
From NEI’s Monthly Market Monitor for February.
Equity
% return in C$

Canada: MSCI Canada; U.S.: MSCI USA; International markets: MSCI EAFE; Emerging markets: MSCI Emerging Markets. Source: Morningstar Direct
Fixed income and currency
% return in C$

Canada investment grade: Bloomberg Barclays Canada Aggregate; Global investment grade: Bloomberg Barclays Global Aggregate; U.S. high yield: Bloomberg Barclays U.S. High Yield. Source: Morningstar Direct.
Rates likely to remain higher for longer
The U.S. economy continues to be surprisingly strong thanks to a tight labour market and positive wage gains that have continued to boost consumer spending. Though core inflation was higher than expected coming in at 3.8% year-over-year, has increased volatility, inflation is still broadly moving in the right direction in the U.S. The Fed’s inflation gauge of choice, the Personal Consumption Expenditures (PCE), has been tamer and strongly supports the disinflation narrative. However, strong economic growth means it may take longer for the Fed to gain confidence that inflation is firmly under control and hurts the case for interest rate cuts in the near term.
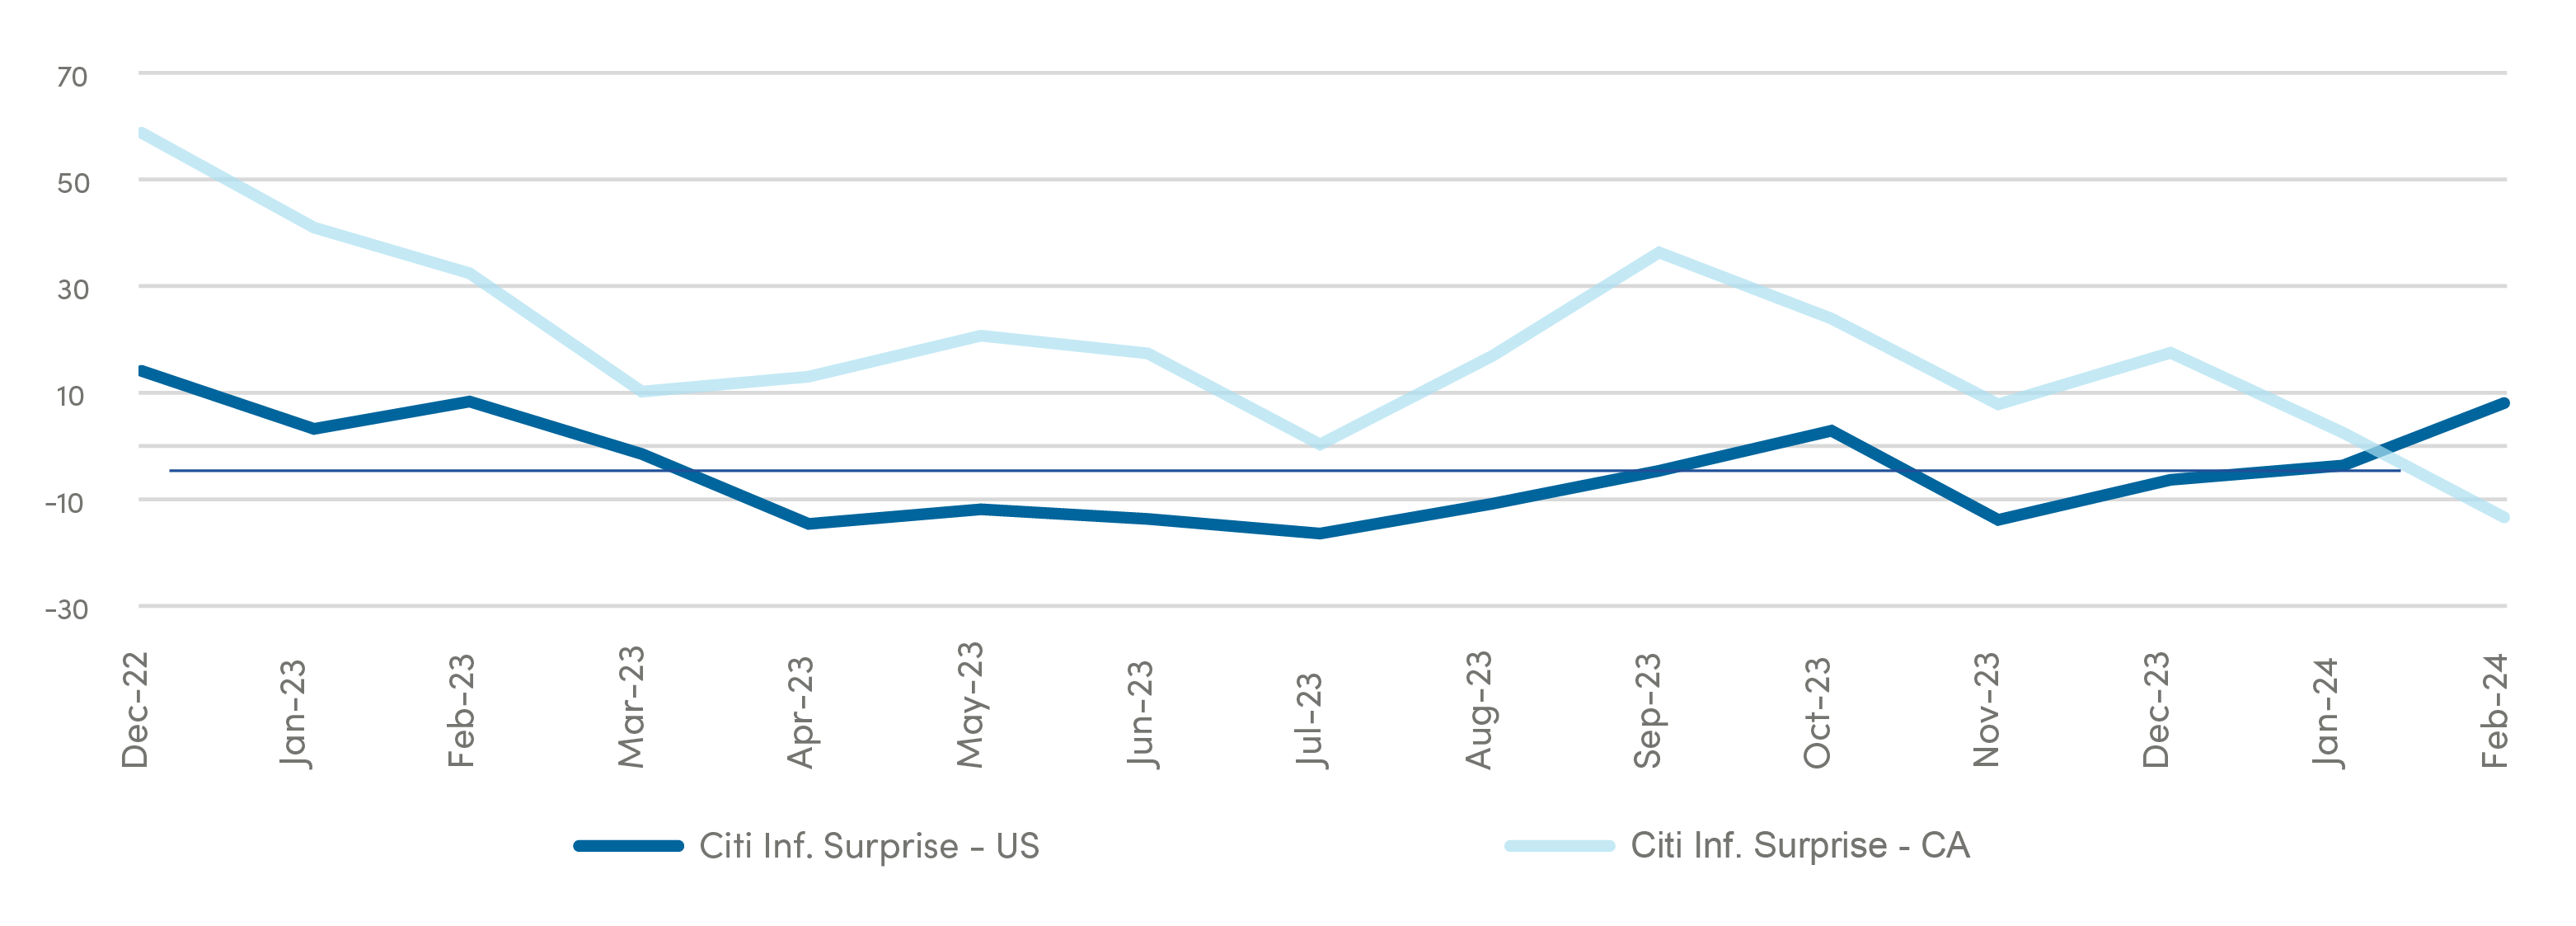
Canada did see inflation cool in January as it came in at 2.9% year-over-year, below expectations of 3.3%. This was mainly due to a decline in energy and food prices, but shelter continues to be the largest contributor to inflation and remains elevated due to the higher mortgage interest costs. The rise in rental prices is also having an impact and Canada’s rapid population growth means that the rising costs of mortgages and rent won’t lead to cooler inflation anytime soon. Although overall inflation continues to move in the right direction, Bank of Canada reiterated the need for more evidence of disinflation before pivoting to interest rate cuts.
Inflation surprises diverging in the U.S. and Canada

Source: Bloomberg, NEI Investments
Strong macro environment continues to support U.S. equities
Despite rate cut expectations being pushed out, equity markets were supported in February by continued strength in the U.S. economy relative to other developed markets like Canada and Europe. The U.S. economy continues to surprise on the upside. Q4 GDP growth was much stronger than expected and Q1 is shaping to be the same. At the same time, inflation is under control in the U.S., falling towards the 2% target. Risk assets tends to perform strongly in this environment.
Successful earnings season in the U.S.
Mega cap companies broadly met or exceeded earnings expectations, contributing to increasingly strong investor sentiment in the markets. It was not only in the S&P 500, but also globally, as equity indices are making new record highs. On Feb. 22, major equity indexes in the U.S., Europe, and Japan reached new record highs. In addition to Nvidia, whose strong earnings delivery and margin expansion prospects propelled prices for the whole semiconductor sector significantly higher, the majority of companies also delivered earnings that were stronger than expectations. By month end, 97% of S&P 500 companies had reported their Q4 earnings, with 75% of them beating estimates.
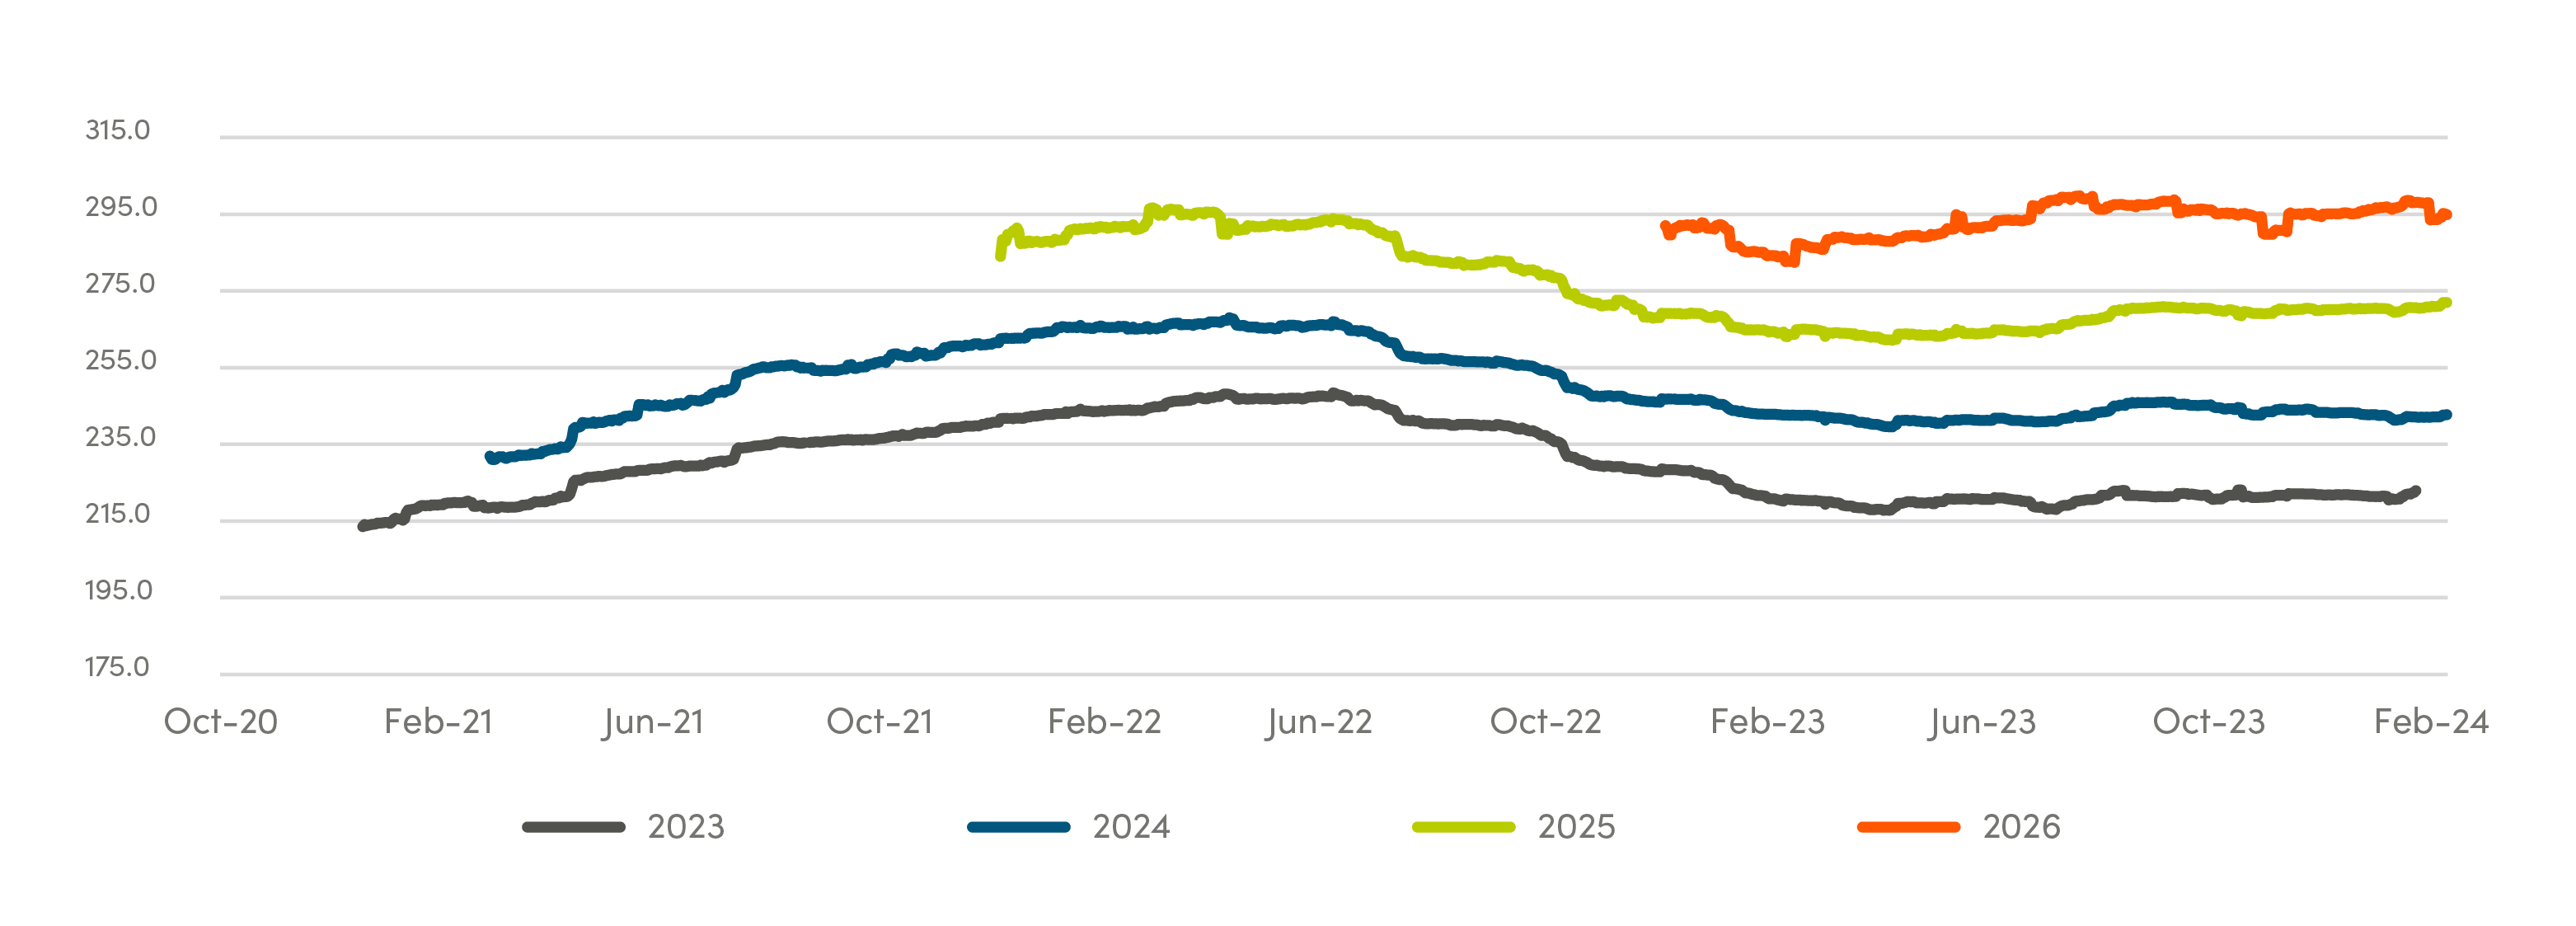
S&P 500 earnings estimates revised upwards for 2025

Source: Bloomberg, NEI Investments
With respect to mega cap names, earnings reports for the last several quarters for the “Magnificent Seven” have largely confirmed the validity of the excitement around them. Valuations for these mega caps remain elevated compared to the broader U.S. equity market. They are, however, justified by their estimated earnings growth of 14%, significantly higher than the 2% year-over-year growth for the remaining 493 stocks in the S&P 500 over the next year. Additionally, the average margin of the 7 companies at 23% is also expanding, much more favorable than the other 493 that is at 9% on average, and slightly contracting next year.
Following an 11% rally upon Nvidia’s earnings announcement, Nvidia was trading at a P/E of just over 30x, back to the same valuation multiple as it was in late 2023, even though its market cap has gone up by approx. US$250B. It took the semiconductor manufacturer 24 years to grow to $1 trillion in market cap, and it took only 8 months to grow the next $1 trillion.

Legal
Aviso Wealth Inc. (“Aviso”) is the parent company of Aviso Financial Inc. (“AFI”) and Northwest & Ethical Investments L.P. (“NEI”). Aviso and Aviso Wealth are registered trademarks owned by Aviso Wealth Inc. NEI Investments is a registered trademark of NEI. Any use by AFI or NEI of an Aviso trade name or trademark is made with the consent and/or license of Aviso Wealth Inc. Aviso is a wholly-owned subsidiary of Aviso Wealth LP, which in turn is owned 50% by Desjardins Financial Holding Inc. and 50% by a limited partnership owned by the five Provincial Credit Union Centrals and The CUMIS Group Limited.
This material is for informational and educational purposes and it is not intended to provide specific advice including, without limitation, investment, financial, tax or similar matters. This document is published by AFI and unless indicated otherwise, all views expressed in this document are those of AFI. The views expressed herein are subject to change without notice as markets change over time. Views expressed regarding a particular industry or market sector should not be considered an indication of trading intent of any funds managed by NEI Investments. Forward-looking statements are not guaranteed of future performance and risks and uncertainties often cause actual results to differ materially from forward-looking information or expectations. Do not place undue reliance on forward-looking information. Mutual funds and other securities are offered through Aviso Financial Inc. Commissions, trailing commissions, management fees and expenses all may be associated with mutual fund investments. Please read the prospectus before investing. Unless otherwise stated, mutual fund securities and cash balances are not insured nor guaranteed, their values change frequently and past performance may not be repeated.
The MSCI information may only be used for your internal use, may not be reproduced or re-disseminated in any form and may not be used as a basis for or a component of any financial instruments or products or indices. None of the MSCI information is intended to constitute investment advice or a recommendation to make (or refrain from making) any kind of investment decision and may not be relied on as such. Historical data and analysis should not be taken as an indication or guarantee of any future performance, analysis, forecast or prediction. The MSCI information is provided on an “as is” basis and the user of this information assumes the entire risk of any use made of this information. MSCI, each of its affiliates and each other person involved in or related to computing, computing or creating any MCI information (collectively, the “MSCI Parties”) expressly disclaims all warranties (including, without limitation, any warranties of originality, accuracy, completeness, timeliness, non-infringement, merchantability and fitness for a particular purpose) with respect to this information. Without limiting any of the foregoing, in no event shall any MSCI Party have any liability for any direct, indirect, special, incidental, punitive, consequential (including, without limitation, lost profits) or any other damages.