April 2023 monthly market insights
Data and opinions as of March 31, 2023
Equities look past crisis while fixed income sends warning signal
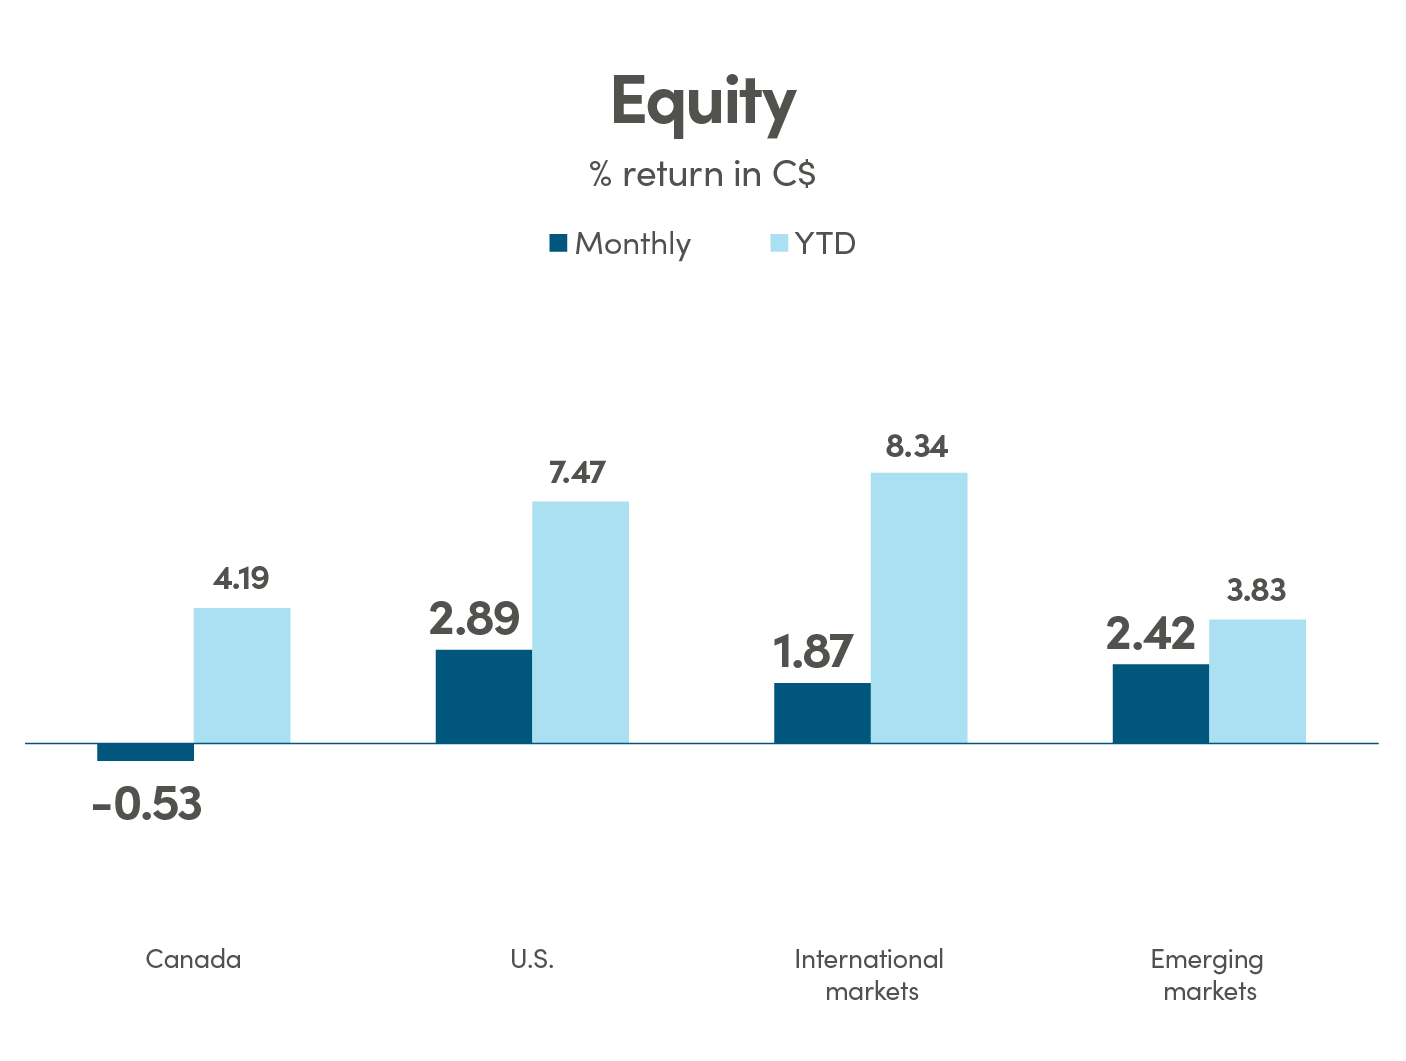
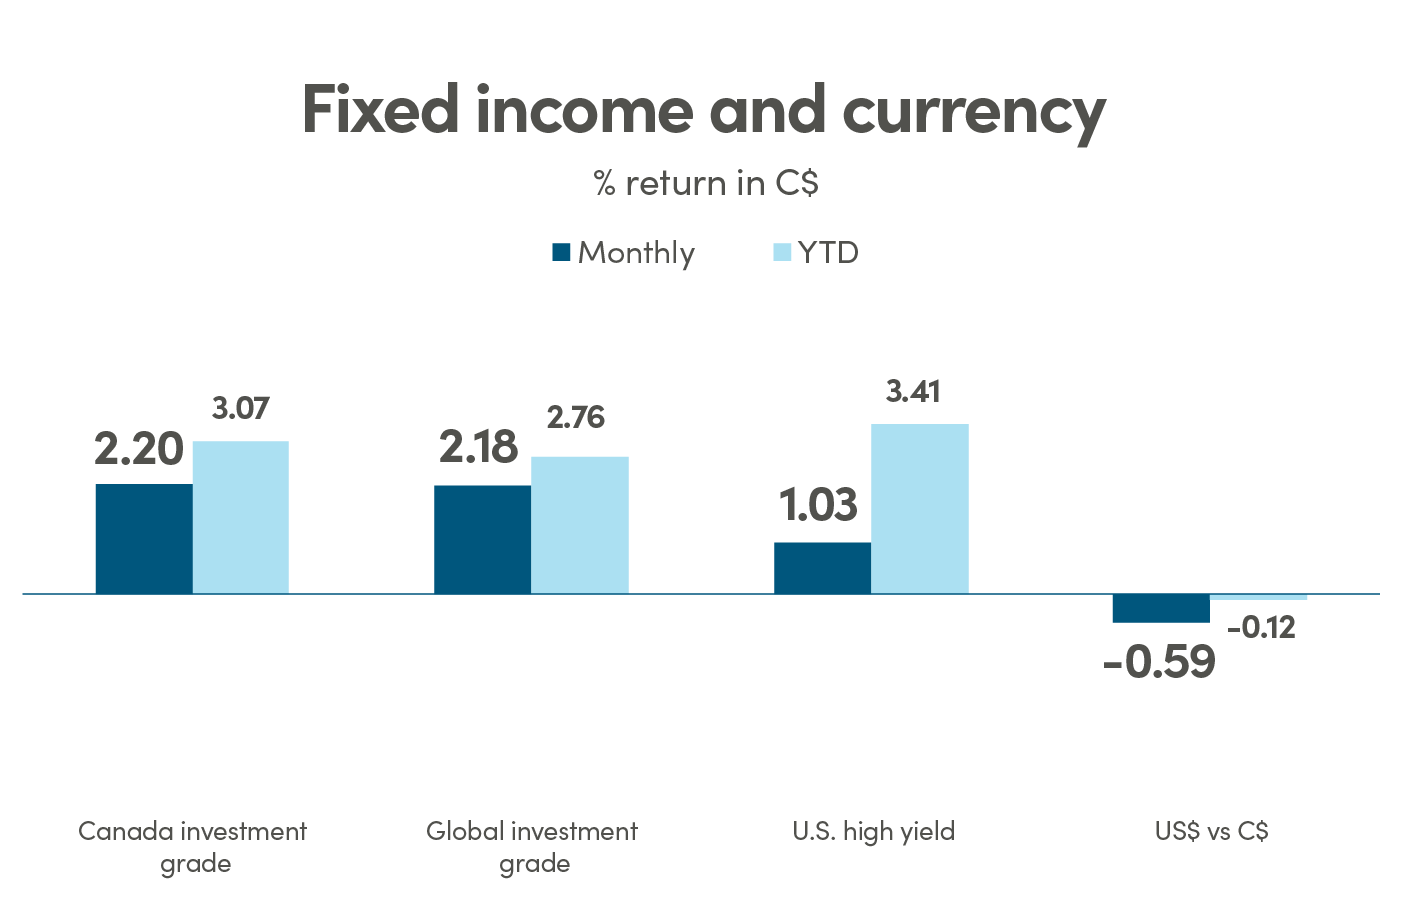
There was plenty of reason to expect a much weaker market given everything that happened throughout March, but somehow investors were able to look past bank failures, rate hikes, and slashed earning estimates with a surprising level of optimism. The S&P was able to end the month in the green up 1.57% and 7.03% for the quarter. The Nasdaq was also up 4.56% in March and 16% for the quarter, its best quarter since 2020. The TSX was dragged down by lower energy prices, falling -2.37% in March, but still up 3.66% for the quarter. The fixed income market was extremely volatile throughout March as the treasure markets saw erratic swings, with 2-year yields regularly whipsawing more than 20-basis points intra-day. The 2-year and 10-year yields fell sharply as investors continue to pile onto the safety of U.S. Treasuries and Money Market funds.
The NEI perspective
Banking crisis raises recession odds as regulators get busy in tightening up regulations, the more immediate fallout of the banking crisis will likely be tightening of lending standards. If tighter lending standards do materialize, it will have a tightening effect on financial conditions, not unlike the effect of rate hikes. This increases the likelihood of the economy slipping into recession later this year.
Surprising economic strength is a key takeaway from the recent economic data releases in North America, Europe, and Emerging Markets. While they continue to surprise to the upside and show that economies are stronger and more resilient than forecasts assume, the sustainability of the resilience is debatable.
Earnings estimates cut again as many analysts continue to drop their earnings estimates for the S&P 500 companies in 2023 and 2024. S&P 500 earnings are now expected to be flat for 2023, down from 10% growth last summer, and could fall further as current valuations are still relatively high compared to previous cycles.
From NEI’s Monthly Market Monitor for March.

Canada: MSCI Canada; U.S.: MSCI USA; International markets: MSCI EAFE; Emerging markets: MSCI Emerging Markets. Source: Morningstar Direct

Canada investment grade: Bloomberg Barclays Canada Aggregate; Global investment grade: Bloomberg Barclays Global Aggregate; U.S. high yield: Bloomberg Barclays U.S. High Yield. Source: Morningstar Direct.
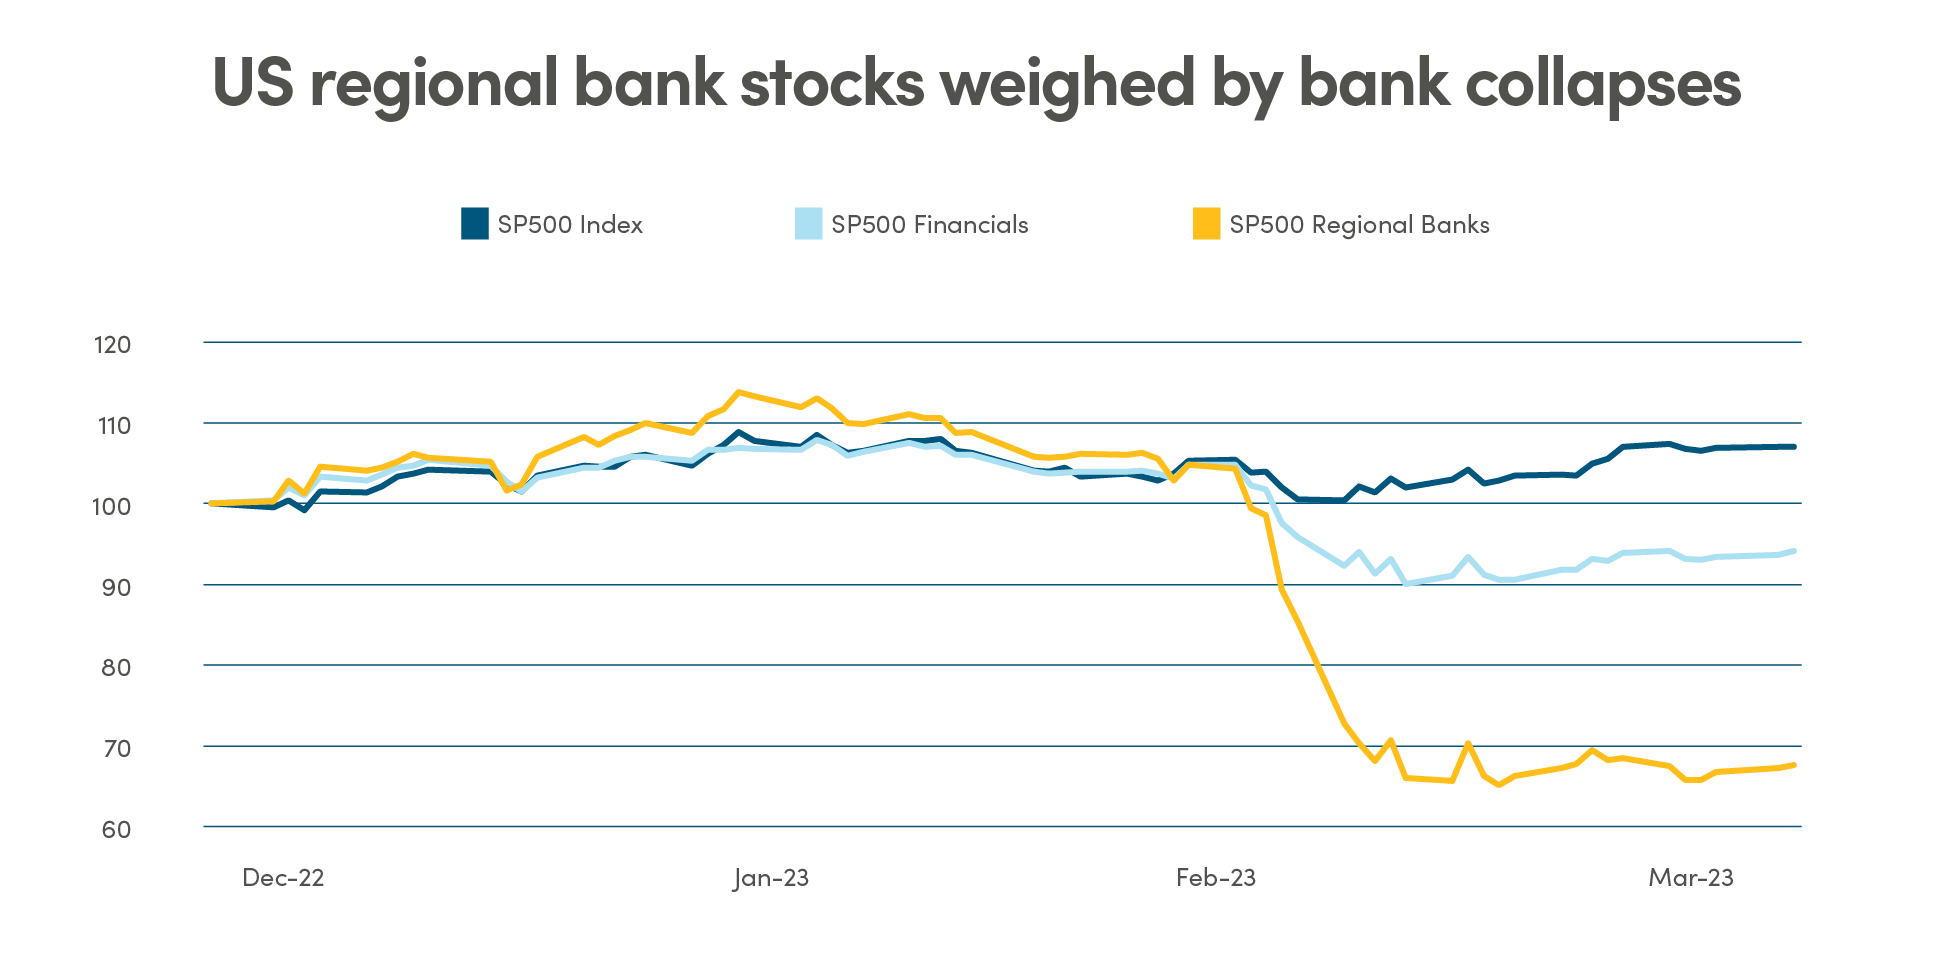
Biggest bank collapses since the Great Financial Crises
The collapse of two U.S. regional banks in early March sparked fear about potential contagion to other regional banks and the stability of the broader banking sector. On March 10 the U.S. regulators took control of Silicon Valley Bank (SVB) following a run on the bank when panicked customers withdrew US$42 billion of deposits in a few days. Similarly, U.S regulators also closed Signature Bank of New York a few days later when depositors withdrew large sums of money. The panic quickly spread to Europe as concerns centered around Credit Suisse defaulting on its debts. Despite the Swiss National Bank’s effort to intervene by providing a CHF 50 billion lifeline, Credit Suisse was ultimately taken over by UBS on March 19 in a deal brokered by the Swiss government and regulators. The bank failures led to a substantial drop in value of regional banking stocks in the U.S. and the financial sector more broadly. The overall equity market, however, bounced back with remarkable resilience, as investors interpret the fallout of the banking crisis as disinflationary, hence alleviating the need for more tightening.

Source: Bloomberg data as of March 31, 2023
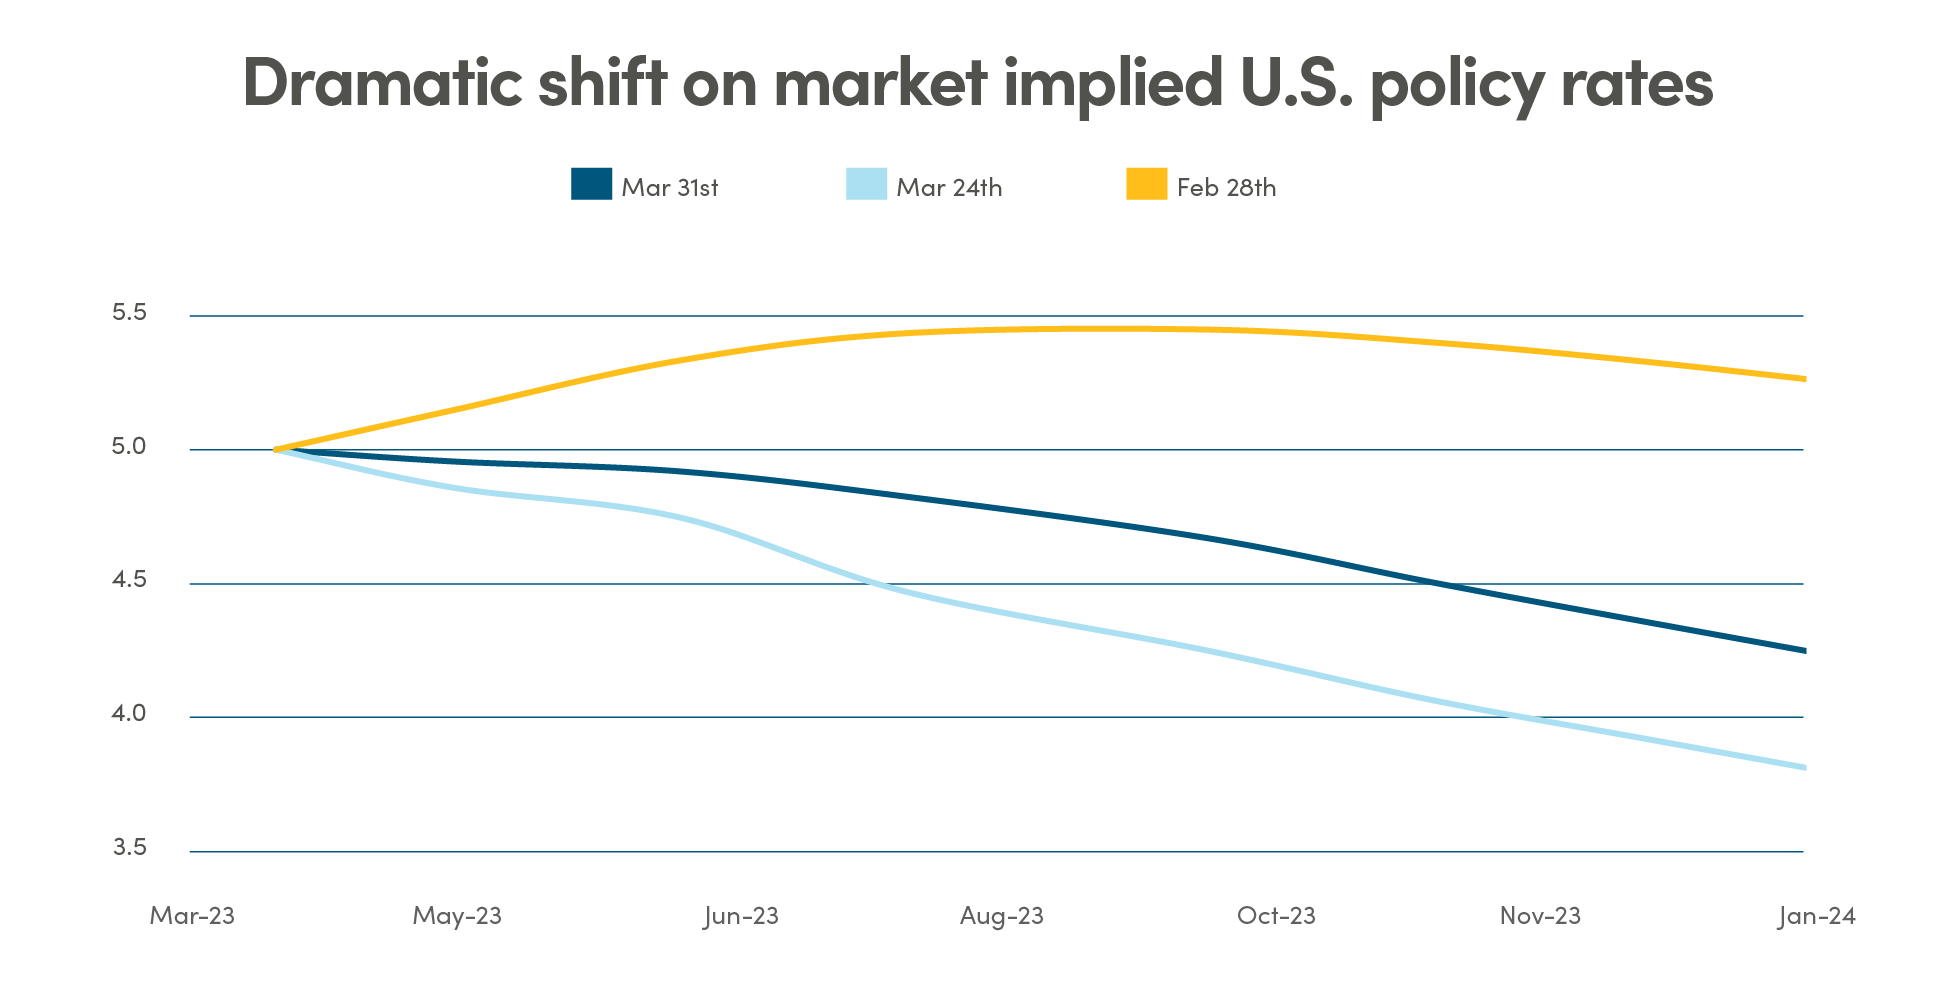
Bank failures impact path of rate hikes
The bank collapses demonstrated to the broader banking industry what poor risk management and duration mismatch could lead to. As the regulators get busy in tightening up regulations, the more immediate fallout of the banking crisis will likely be tightening of lending standards. If tighter lending standards do materialize, it will have a tightening effect on financial conditions, not unlike the effect of rate hikes. This increases the likelihood of the economy slipping into recession later this year. The fixed income markets swiftly softened their views on the path of policy rates. Currently, markets are pricing in Fed rate cuts of 0.75% and Bank of Canada cuts of 0.50% by year end. At the beginning of March, December policy rates for both BoC and Fed were expected to be flat from current levels.

Source: Bloomberg data as of March 31, 2023
While some analysts speculate that central banks may pause on tightening given the uncertainty on how much the banking crisis may weigh on the economy, central banks stayed the course and remained focused on inflation. The European Central Bank hiked rates by 50 bps on March 16 and the U.S. Federal Reserve hiked by 25bps the following week. Despite the Fed’s insistence that there is still more tightening required to tame inflation, contrary to market views that they will need to start cutting rates by the summer this year to mitigate economic contraction.
The steep rise in interest rates and the confidence crisis on banks improved the attractiveness of money market funds as a safe haven, contributing to increased flows to money market funds over the past 12 months. As much as $600 billion of deposits have left banks since the hiking cycle began. By the end of March, US$5.2 trillion is sitting in money market funds, a new record high.
Canada ramps up spending in “green” budget
On Tuesday March 28, 2023, Finance Minister Chrystia Freeland tabled the Liberal government’s 2023-24 Federal Budget in Parliament. The budget includes plans to spend nearly $70 billion more between now and 2027-28—with $59.5 billion rolling out over the next five years—while offsetting this with close to $25 billion in cuts and savings. As a result, the federal deficit is projected to be $43 billion this fiscal year.
A core focus of the budget is developing Canada’s green economy by introducing new corporate tax credits meant to encourage investment in clean energy, by focusing on clean electricity and for clean technology manufacturing and processing and critical mineral extraction. Plus $20 billion commitment to the Canada Infrastructure Bank to support building of major clean electricity and clean growth infrastructure projects.
Despite the federal budget spending pushing deficit well into 2027-2028, it was well received by markets. Canadian stocks, bonds and CAD gained modestly for the day. The increase on spending provides targeted support for clean and sustainable growth projects, which is essential to keep Canada competitive, especially considering the Inflation Reduction Act in the U.S.

Legal
Aviso Wealth Inc. (“Aviso”) is the parent company of Aviso Financial Inc. (“AFI”) and Northwest & Ethical Investments L.P. (“NEI”). Aviso and Aviso Wealth are registered trademarks owned by Aviso Wealth Inc. NEI Investments is a registered trademark of NEI. Any use by AFI or NEI of an Aviso trade name or trademark is made with the consent and/or license of Aviso Wealth Inc. Aviso is a wholly-owned subsidiary of Aviso Wealth LP, which in turn is owned 50% by Desjardins Financial Holding Inc. and 50% by a limited partnership owned by the five Provincial Credit Union Centrals and The CUMIS Group Limited.
This material is for informational and educational purposes and it is not intended to provide specific advice including, without limitation, investment, financial, tax or similar matters. This document is published by AFI and unless indicated otherwise, all views expressed in this document are those of AFI. The views expressed herein are subject to change without notice as markets change over time. Views expressed regarding a particular industry or market sector should not be considered an indication of trading intent of any funds managed by NEI Investments. Forward-looking statements are not guaranteed of future performance and risks and uncertainties often cause actual results to differ materially from forward-looking information or expectations. Do not place undue reliance on forward-looking information. Mutual funds and other securities are offered through Aviso Financial Inc. Commissions, trailing commissions, management fees and expenses all may be associated with mutual fund investments. Please read the prospectus before investing. Unless otherwise stated, mutual fund securities and cash balances are not insured nor guaranteed, their values change frequently and past performance may not be repeated.
The MSCI information may only be used for your internal use, may not be reproduced or re-disseminated in any form and may not be used as a basis for or a component of any financial instruments or products or indices. None of the MSCI information is intended to constitute investment advice or a recommendation to make (or refrain from making) any kind of investment decision and may not be relied on as such. Historical data and analysis should not be taken as an indication or guarantee of any future performance, analysis, forecast or prediction. The MSCI information is provided on an “as is” basis and the user of this information assumes the entire risk of any use made of this information. MSCI, each of its affiliates and each other person involved in or related to computing, computing or creating any MCI information (collectively, the “MSCI Parties”) expressly disclaims all warranties (including, without limitation, any warranties of originality, accuracy, completeness, timeliness, non-infringement, merchantability and fitness for a particular purpose) with respect to this information. Without limiting any of the foregoing, in no event shall any MSCI Party have any liability for any direct, indirect, special, incidental, punitive, consequential (including, without limitation, lost profits) or any other damages.