February 2023 Monthly Market Insights
Data and opinions as of January 31, 2023
Markets start strong in January
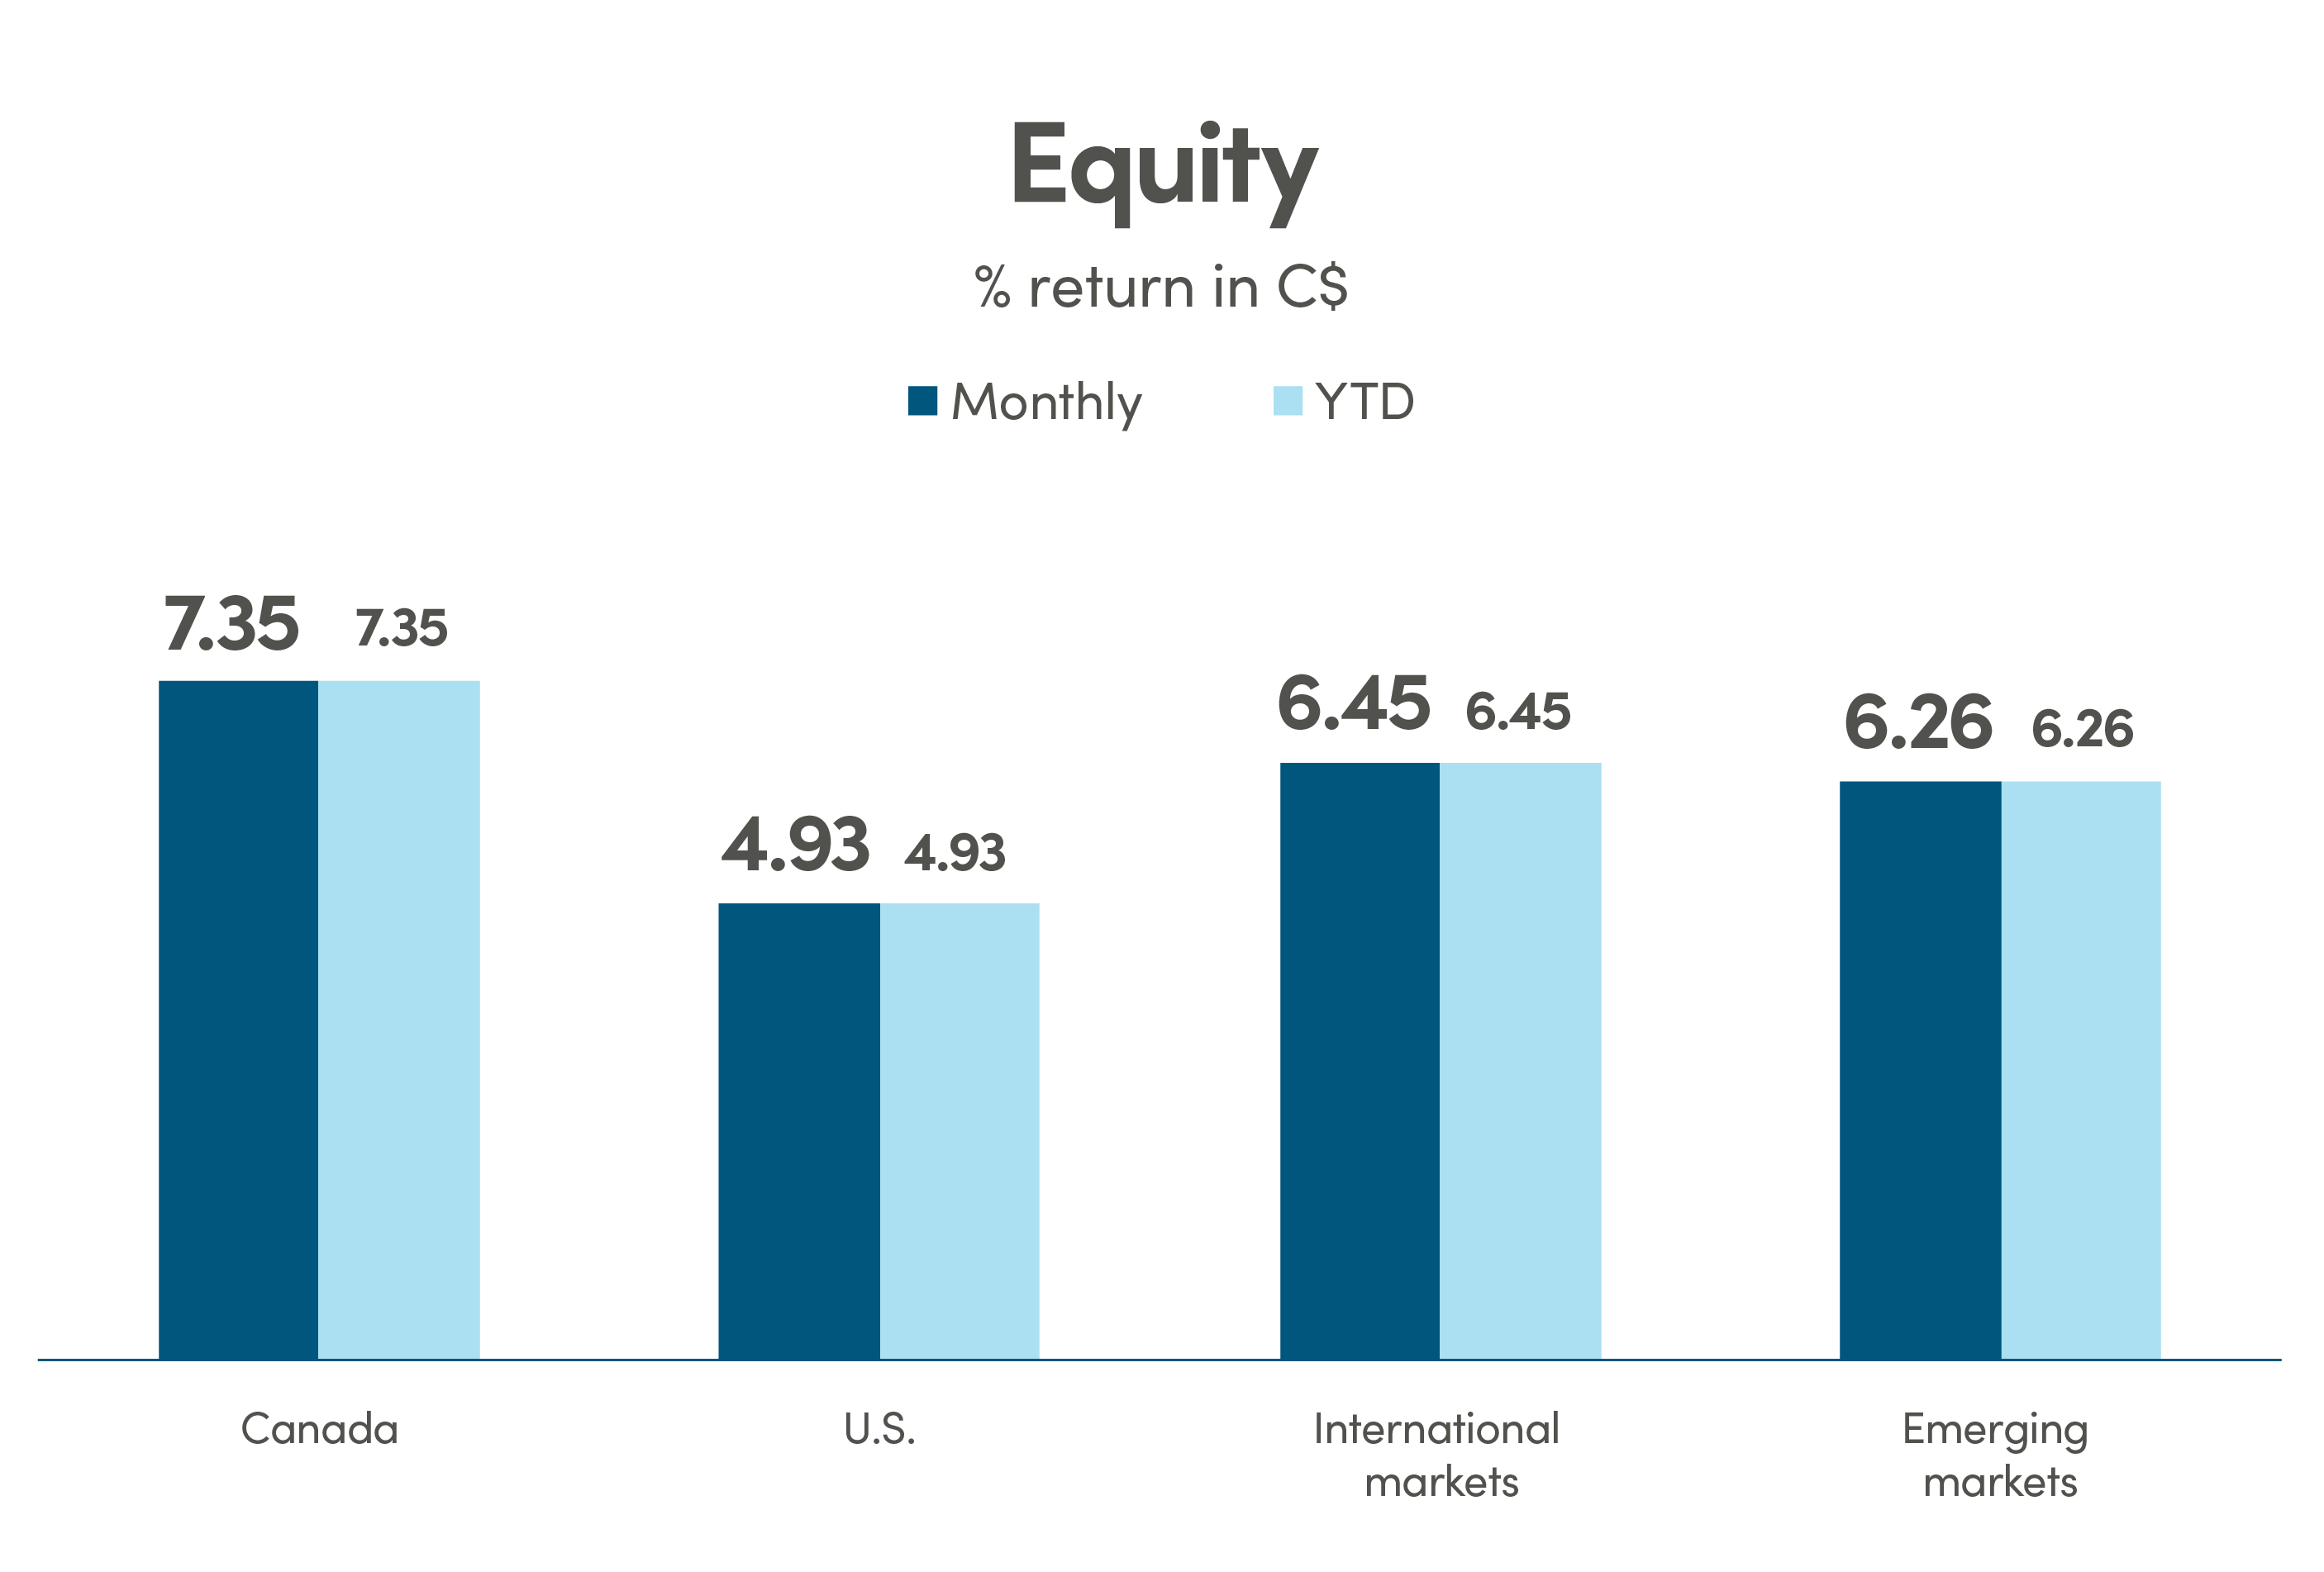
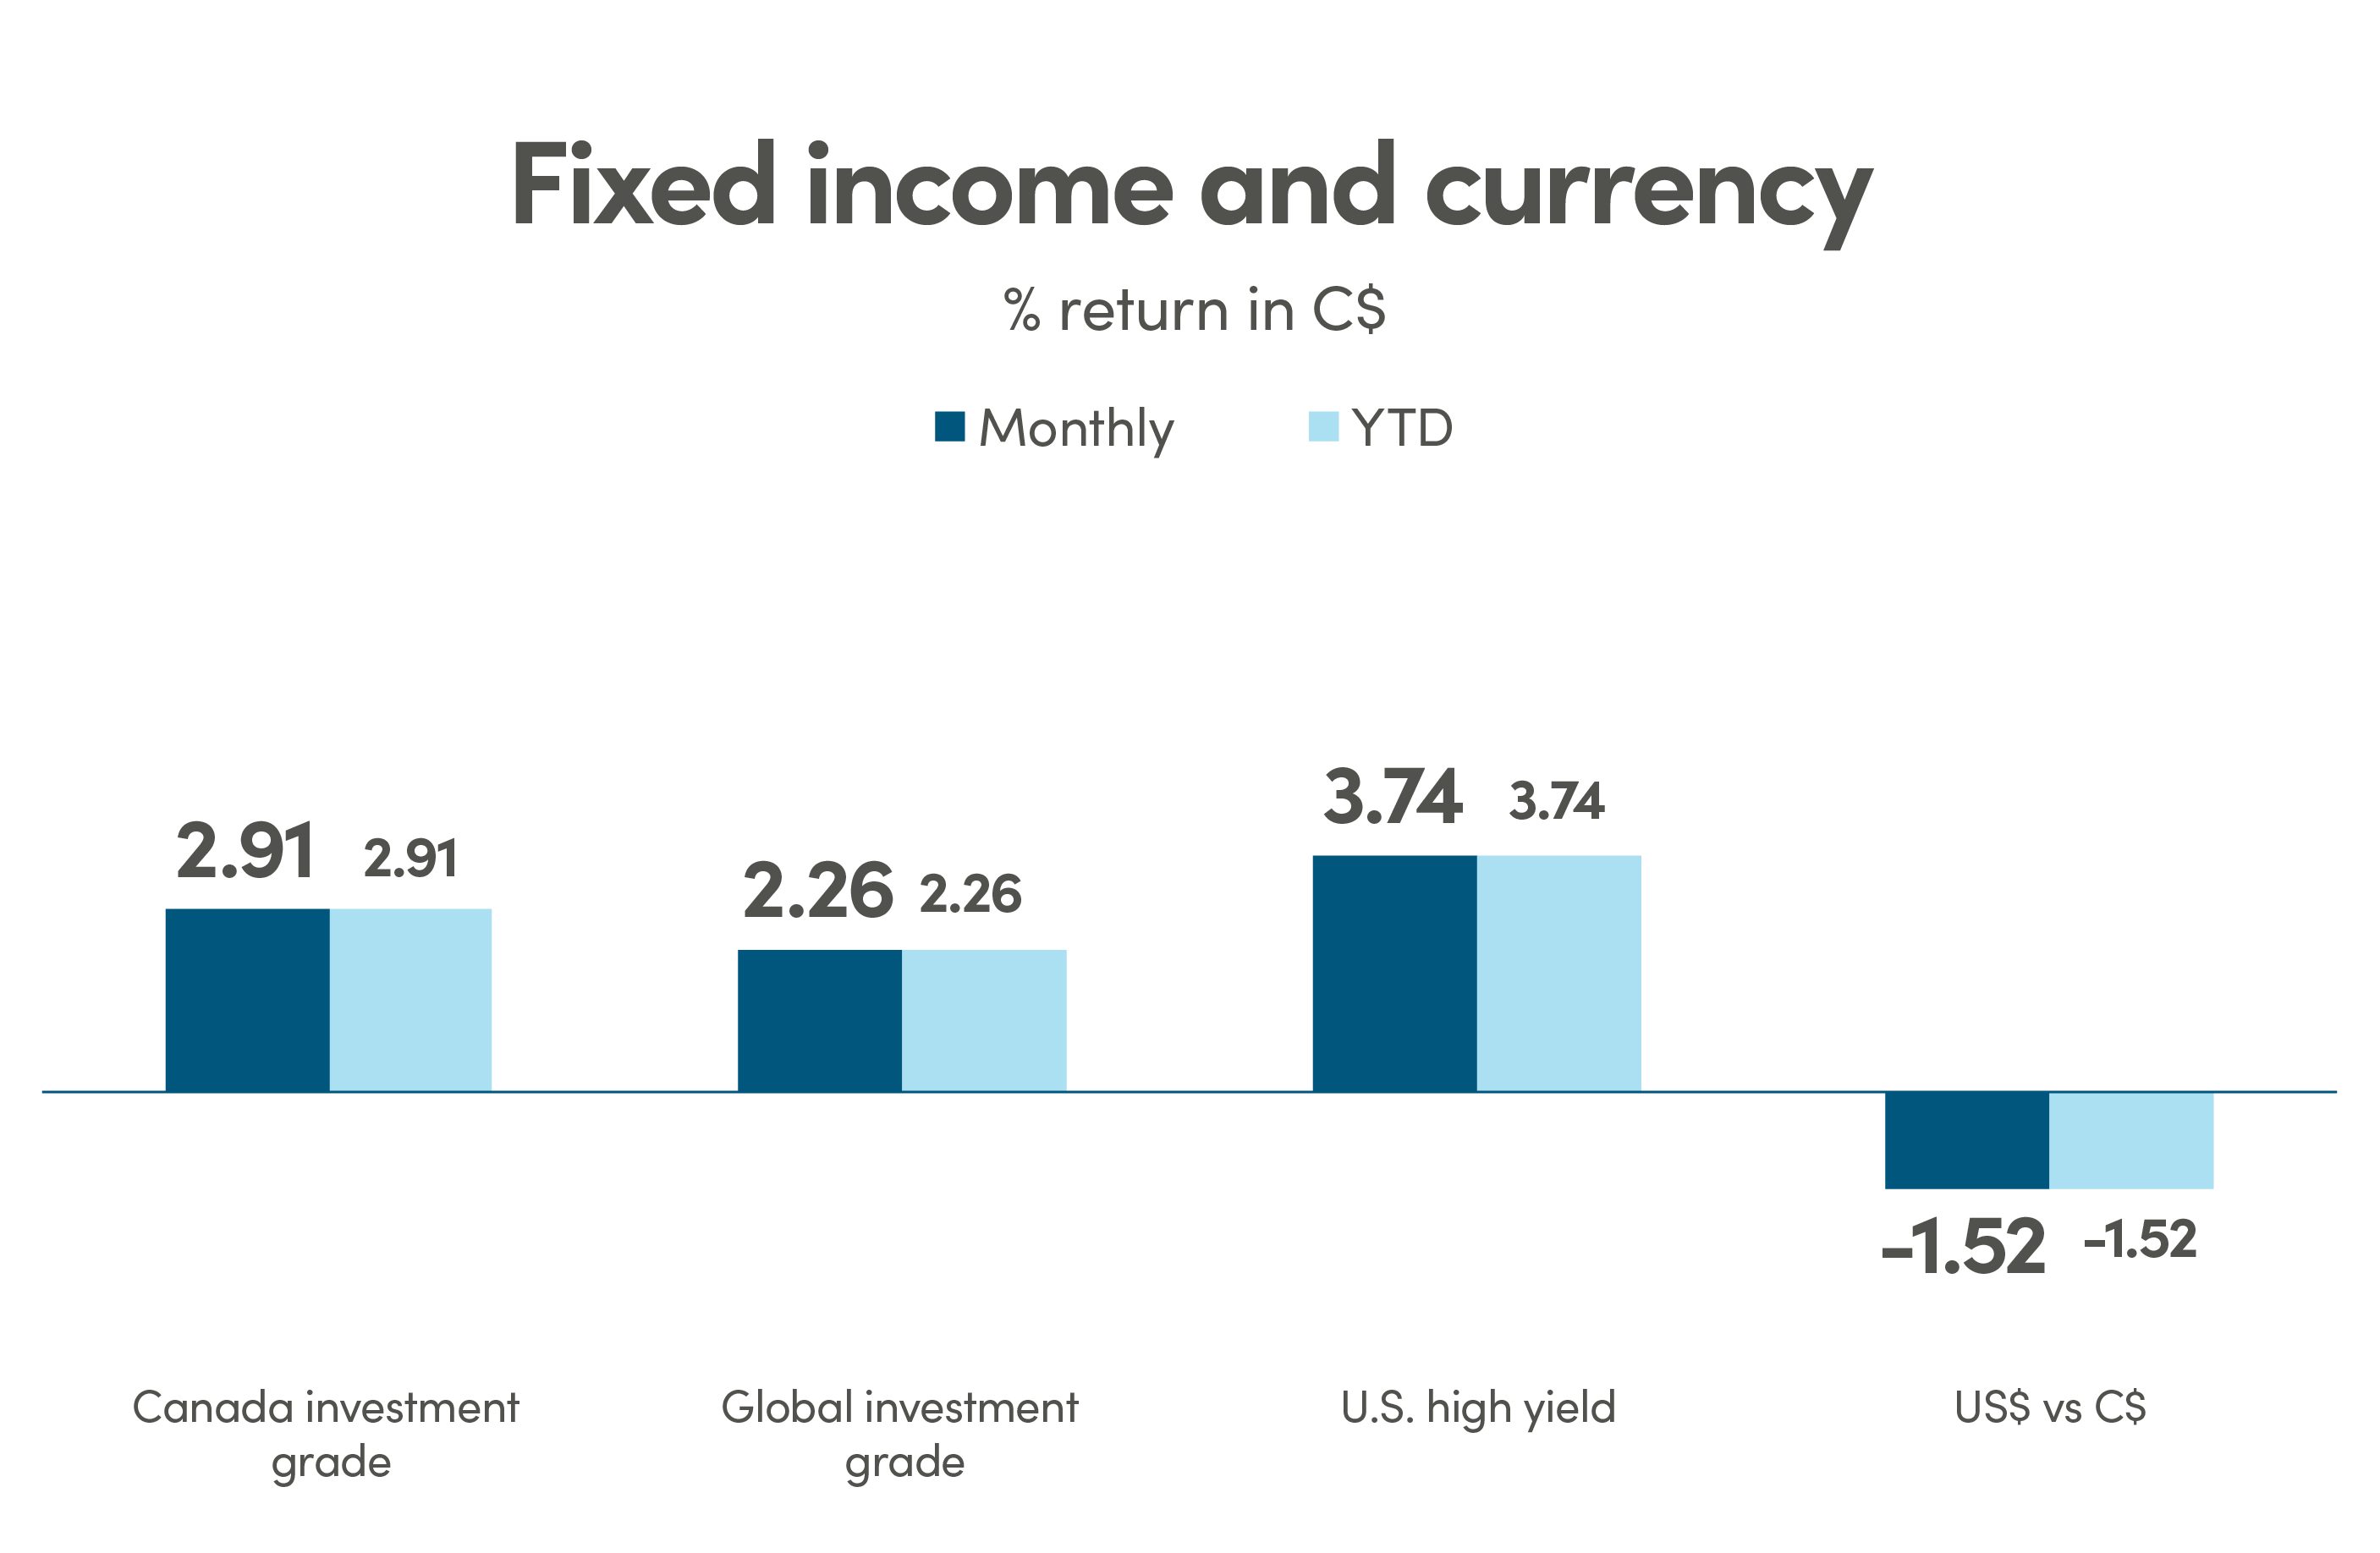
The markets began the year with a stunning rally. U.S. bonds had the best January since 1988, stocks had the best start since 2019, providing a favourable backdrop for the 60/40 balanced portfolio after a horrendous 2022. Market breadth around the rally started off narrow but has since widened. The Europe 600 Index rallied nearly 16% since falling to its October lows to reach a new high on January 18. China’s CSI 300 also extended its rally since hitting a bottom at the end of September, to rise nearly 16% by the end of January. The remarkable improvement on sentiment was fueled by speculation that the central banks will reach the end of the monetary tightening and will start easing rates later this year, in addition to China’s re-opening and Europe’s stronger-than-expected growth momentum. The subpar start to the Q4 earnings season for the S&P 500 has not been enough to derail price momentum, as a number of large technology companies had surprise negative earnings.
The NEI perspective
China’s surprise reopening has provided a strong tailwind to global growth. Economies globally have benefited from China’s rapid economic growth and the rising demand for goods over the past two decades, but also poses upside risk for inflation as commodity prices rise with demand.
Europe’s warm winter has provided much needed breathing room for natural gas prices following previous predications of a potential energy crises through the winter. With headline inflation in the Euro-zone coming down due to the sharp drop in energy prices, the NEI team sees opportunity in the region given attractive relative valuations.
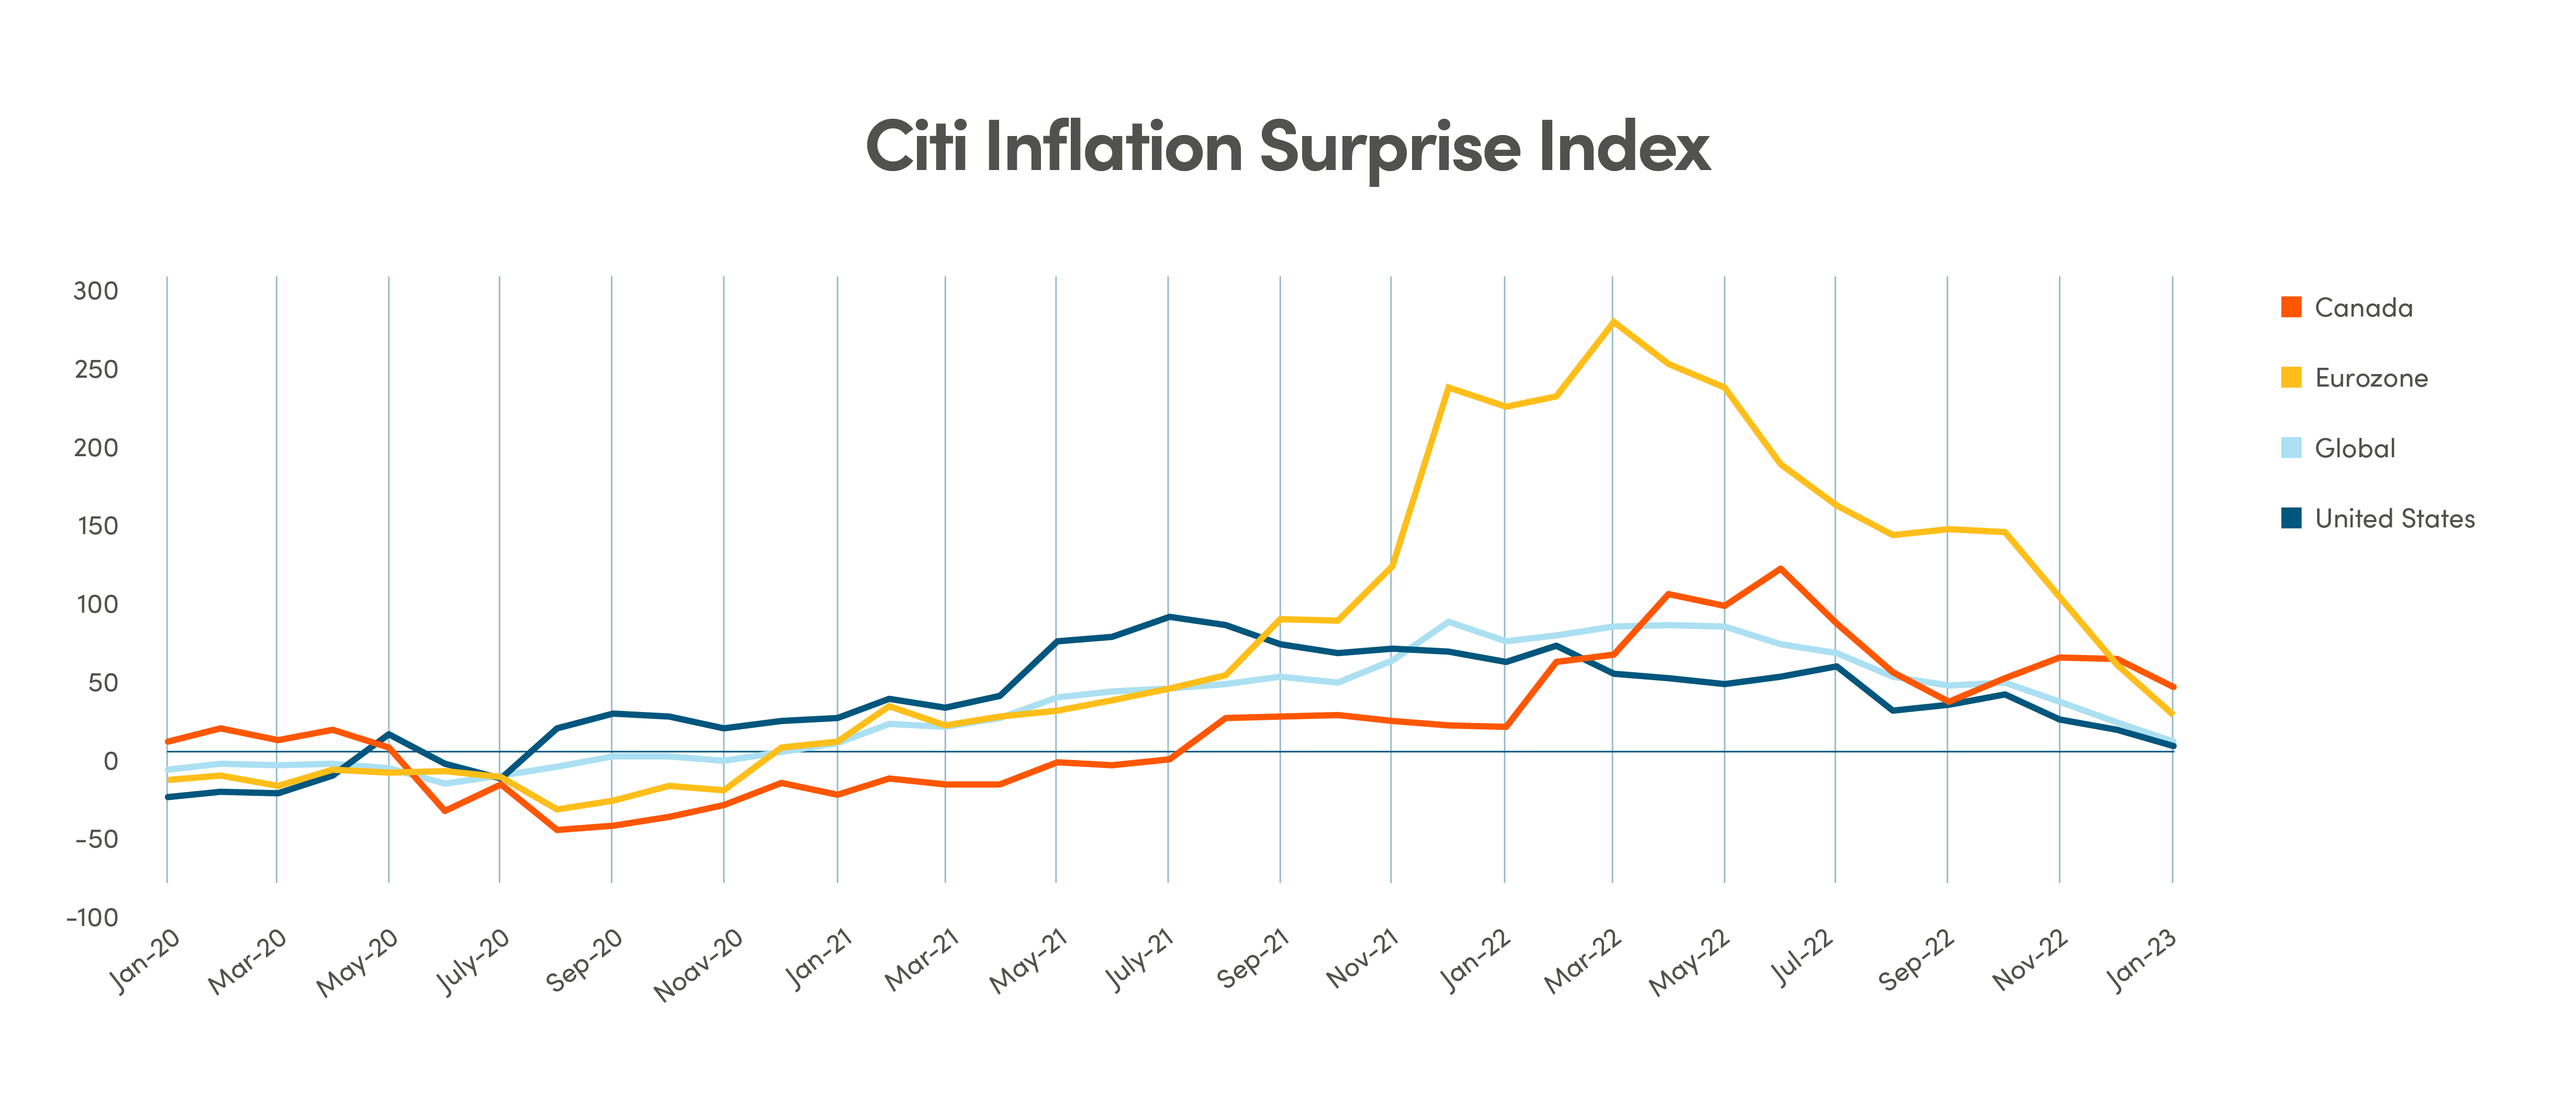
Positive economic signals are showing the unexpected strength of the global economy despite persistent fears of a recession. Although the economic surprise index, inflation surprise index and labour market data indicated that the economy is more resilient than expected, NEI still sees downside risks due to concerns about softer earnings, elevated valuation, and heightened recession risks.
From NEI’s Monthly Market Monitor for January.

Canada: MSCI Canada; U.S.: MSCI USA; International markets: MSCI EAFE; Emerging markets: MSCI Emerging Markets. Source: Morningstar Direct

Canada investment grade: Bloomberg Barclays Canada Aggregate; Global investment grade: Bloomberg Barclays Global Aggregate; U.S. high yield: Bloomberg Barclays U.S. High Yield. Source: Morningstar Direct.
China’s re-opening provides near-term boost
In a surprise move, the Chinese government reopened the country on January 8. Most observers were expecting a more measured easing after enforcing the country’s zero-Covid policy in a draconian fashion for three years. Market sentiment turned positive overnight, as the re-opening provides a path to a sustainable recovery in China’s domestic economy.
China’s re-opening also provides a strong tailwind to global growth. Economies globally have benefited from China’s rapid economic growth and the rising demand for goods over the past two decades as it’s become the world’s second largest economy. The resumption of tourism and removal of most pandemic restrictions has lifted demand for energy and commodities such as oil, copper, and iron ore. However, it also posts upside risk on inflation with commodity prices pushed higher. The International Monetary Fund (IMF) revised their global growth forecast upwards by 0.2% to 2.9% in 2023, citing China’s re-opening as a key factor. The MSCI China Index extended the rally that began late last year, rising by over 50% since November 2022, while the MSCI Emerging Market Index also jumped by over 20% from the trough in October.

Source: Bloomberg data as of January 31, 2023
Inflation pressures cooling across the globe
With the exception of ski hills operators, Europeans welcomed the record-breaking temperatures this January, which gave the energy crisis in the region much needed breathing room. Gas prices have collapsed over 80% from last summer’s highs as lower demand for heating has left gas reserve at a 78% of capacity vs five-year average of 58%, helping to relieve inflationary pressure. Euro-area headline inflation slowed to 8.5%, well below consensus expectations of 8.9%, with a sharp drop in energy contribution as the main driver of decline. Inflationary pressures are easing across the globe as expected, as supply chain bottlenecks continue to heal, commodity prices retreat, and tight monetary policies have started to work through the system to bring supply-demand dynamics back in balance.

Source: Bloomberg data as of November 30, 2022
Despite inflation cooling on cue, central banks are keeping with their hawkish tone and continue with their policy tightening (notwithstanding Fed Chairman Jay Powell’s dovish off-script comments after the press conference). Major central banks including Bank of Canada, Bank of England, European Central Bank, and the Fed have delivered rate hikes, in line with market expectations in their first meetings in 2023. While Canada may be done with rate hikes for now, other central banks are expected to have more to come in the coming months. The bond markets are still convinced that the Fed will need to cut rates if the economy falls into a recession in the second half of 2023; but the January rally in the equity markets suggests the prospects of a soft-landing is rising, which is very much contrary to what the current economic data is indicating.
Concerns around valuations continue despite improving sentiment
The most recent market rebound since last October has propelled the U.S. market to over 18x forward earnings, much richer than its 20-year historical average of 15x forward earnings. This valuation puts U.S. markets at an overbought level even without considering recession risk and is at significant downside risk if we are indeed marching towards one. Further to that, we think that earnings estimates are likely to be revised further downwards from current levels with companies lowering their forward guidance for 2023, putting downward pressure on prices. The valuation gap against the U.S. markets has narrowed somewhat, but Europe’s Stoxx 600 Index continues to be more attractive at around 13x forward earnings, back to the 20-year historical average after the recent rebound. On the fixed income side, sovereign yields have room to fall further if recession materializes. U.S. high-yield credit spreads are trading barely above 400 bps, below the 20-year average and far lower than the median spreads during recessionary episodes (~1000 bps). On a technical front, the deep inversion across the U.S. Treasury yield curve and U.S. leading economic indicators continue to flag heightened recession risk.

Legal
Aviso Wealth Inc. (“Aviso”) is the parent company of Aviso Financial Inc. (“AFI”) and Northwest & Ethical Investments L.P. (“NEI”). Aviso and Aviso Wealth are registered trademarks owned by Aviso Wealth Inc. NEI Investments is a registered trademark of NEI. Any use by AFI or NEI of an Aviso trade name or trademark is made with the consent and/or license of Aviso Wealth Inc. Aviso is a wholly-owned subsidiary of Aviso Wealth LP, which in turn is owned 50% by Desjardins Financial Holding Inc. and 50% by a limited partnership owned by the five Provincial Credit Union Centrals and The CUMIS Group Limited.
This material is for informational and educational purposes and it is not intended to provide specific advice including, without limitation, investment, financial, tax or similar matters. This document is published by AFI and unless indicated otherwise, all views expressed in this document are those of AFI. The views expressed herein are subject to change without notice as markets change over time. Views expressed regarding a particular industry or market sector should not be considered an indication of trading intent of any funds managed by NEI Investments. Forward-looking statements are not guaranteed of future performance and risks and uncertainties often cause actual results to differ materially from forward-looking information or expectations. Do not place undue reliance on forward-looking information. Mutual funds and other securities are offered through Aviso Financial Inc. Commissions, trailing commissions, management fees and expenses all may be associated with mutual fund investments. Please read the prospectus before investing. Unless otherwise stated, mutual fund securities and cash balances are not insured nor guaranteed, their values change frequently and past performance may not be repeated.
The MSCI information may only be used for your internal use, may not be reproduced or re-disseminated in any form and may not be used as a basis for or a component of any financial instruments or products or indices. None of the MSCI information is intended to constitute investment advice or a recommendation to make (or refrain from making) any kind of investment decision and may not be relied on as such. Historical data and analysis should not be taken as an indication or guarantee of any future performance, analysis, forecast or prediction. The MSCI information is provided on an “as is” basis and the user of this information assumes the entire risk of any use made of this information. MSCI, each of its affiliates and each other person involved in or related to computing, computing or creating any MCI information (collectively, the “MSCI Parties”) expressly disclaims all warranties (including, without limitation, any warranties of originality, accuracy, completeness, timeliness, non-infringement, merchantability and fitness for a particular purpose) with respect to this information. Without limiting any of the foregoing, in no event shall any MSCI Party have any liability for any direct, indirect, special, incidental, punitive, consequential (including, without limitation, lost profits) or any other damages.