March 2023 monthly market insights
Data and opinions as of February 28, 2023
Markets fatigued in February
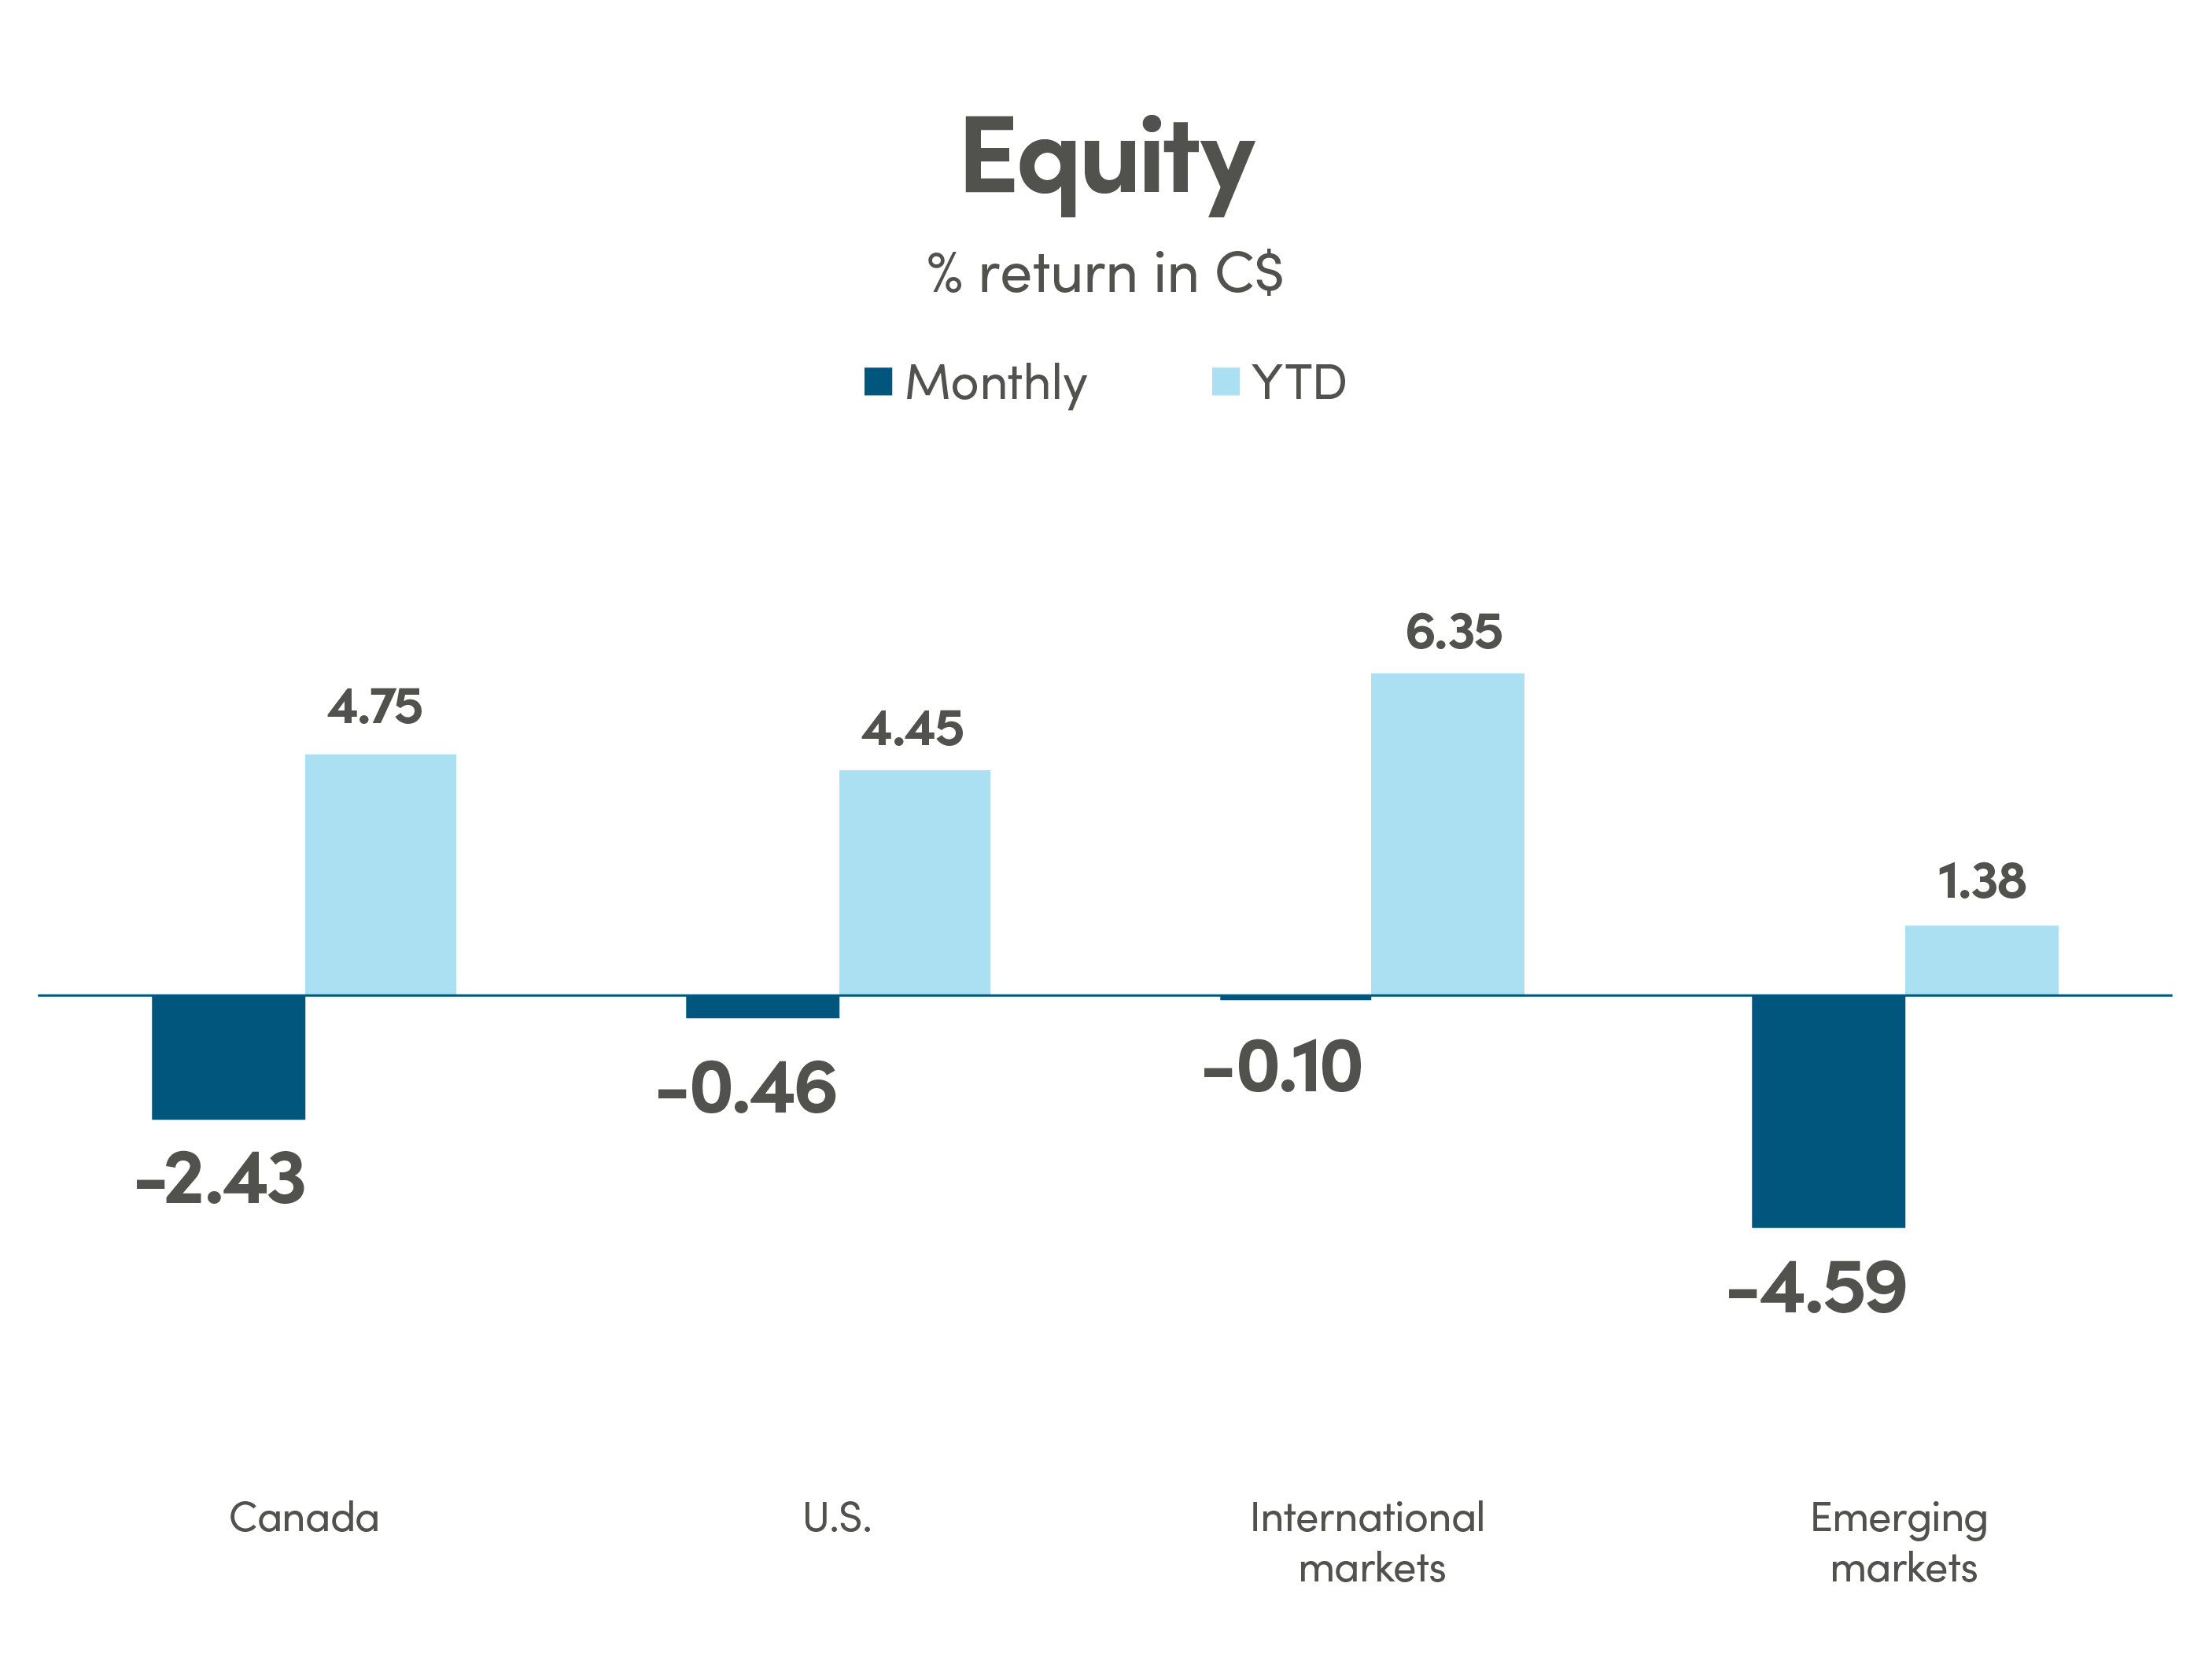
The sizzling rally in January may have gone too far and markets began to cool in February in response to signals that the economy remains too hot. Central banks may not be done in tightening just yet. Recent surprise in labour market data and an uptick in inflation suggests that rates will need to move even higher and will likely stay higher for longer than anticipated last month. The Federal Reserve and other global central banks will likely have to continue on their path of tightening and more rate hikes may be required to tame the sticky inflation. The markets peaked in early February and began to taper in the middle of the month as investors questioned the sustainability of the rally given rich valuations and elevated recession risks. The risk-on sentiment quickly disappeared after a flash appearance in January. The S&P 500 index ended the month just below the 4000 level that it has been hovering around since mid-2022.
The NEI perspective
Recession narrative evolves as economies continue to show resilience and pockets of strength. The soft-landing/hard-landing narrative has pivoted towards a potential “no-landing” scenario which points to continued by anemic economic growth, low unemployment and moderating inflation.
Inflation pressures re-ignited as some countries like the U.S., Germany and Japan saw surprise upticks in their January inflation data as spending on goods and services picked up. While consumer demand for goods is falling, the combination of job gains, higher consumer demand and rising wages will likely continue to put pressures on service inflation.
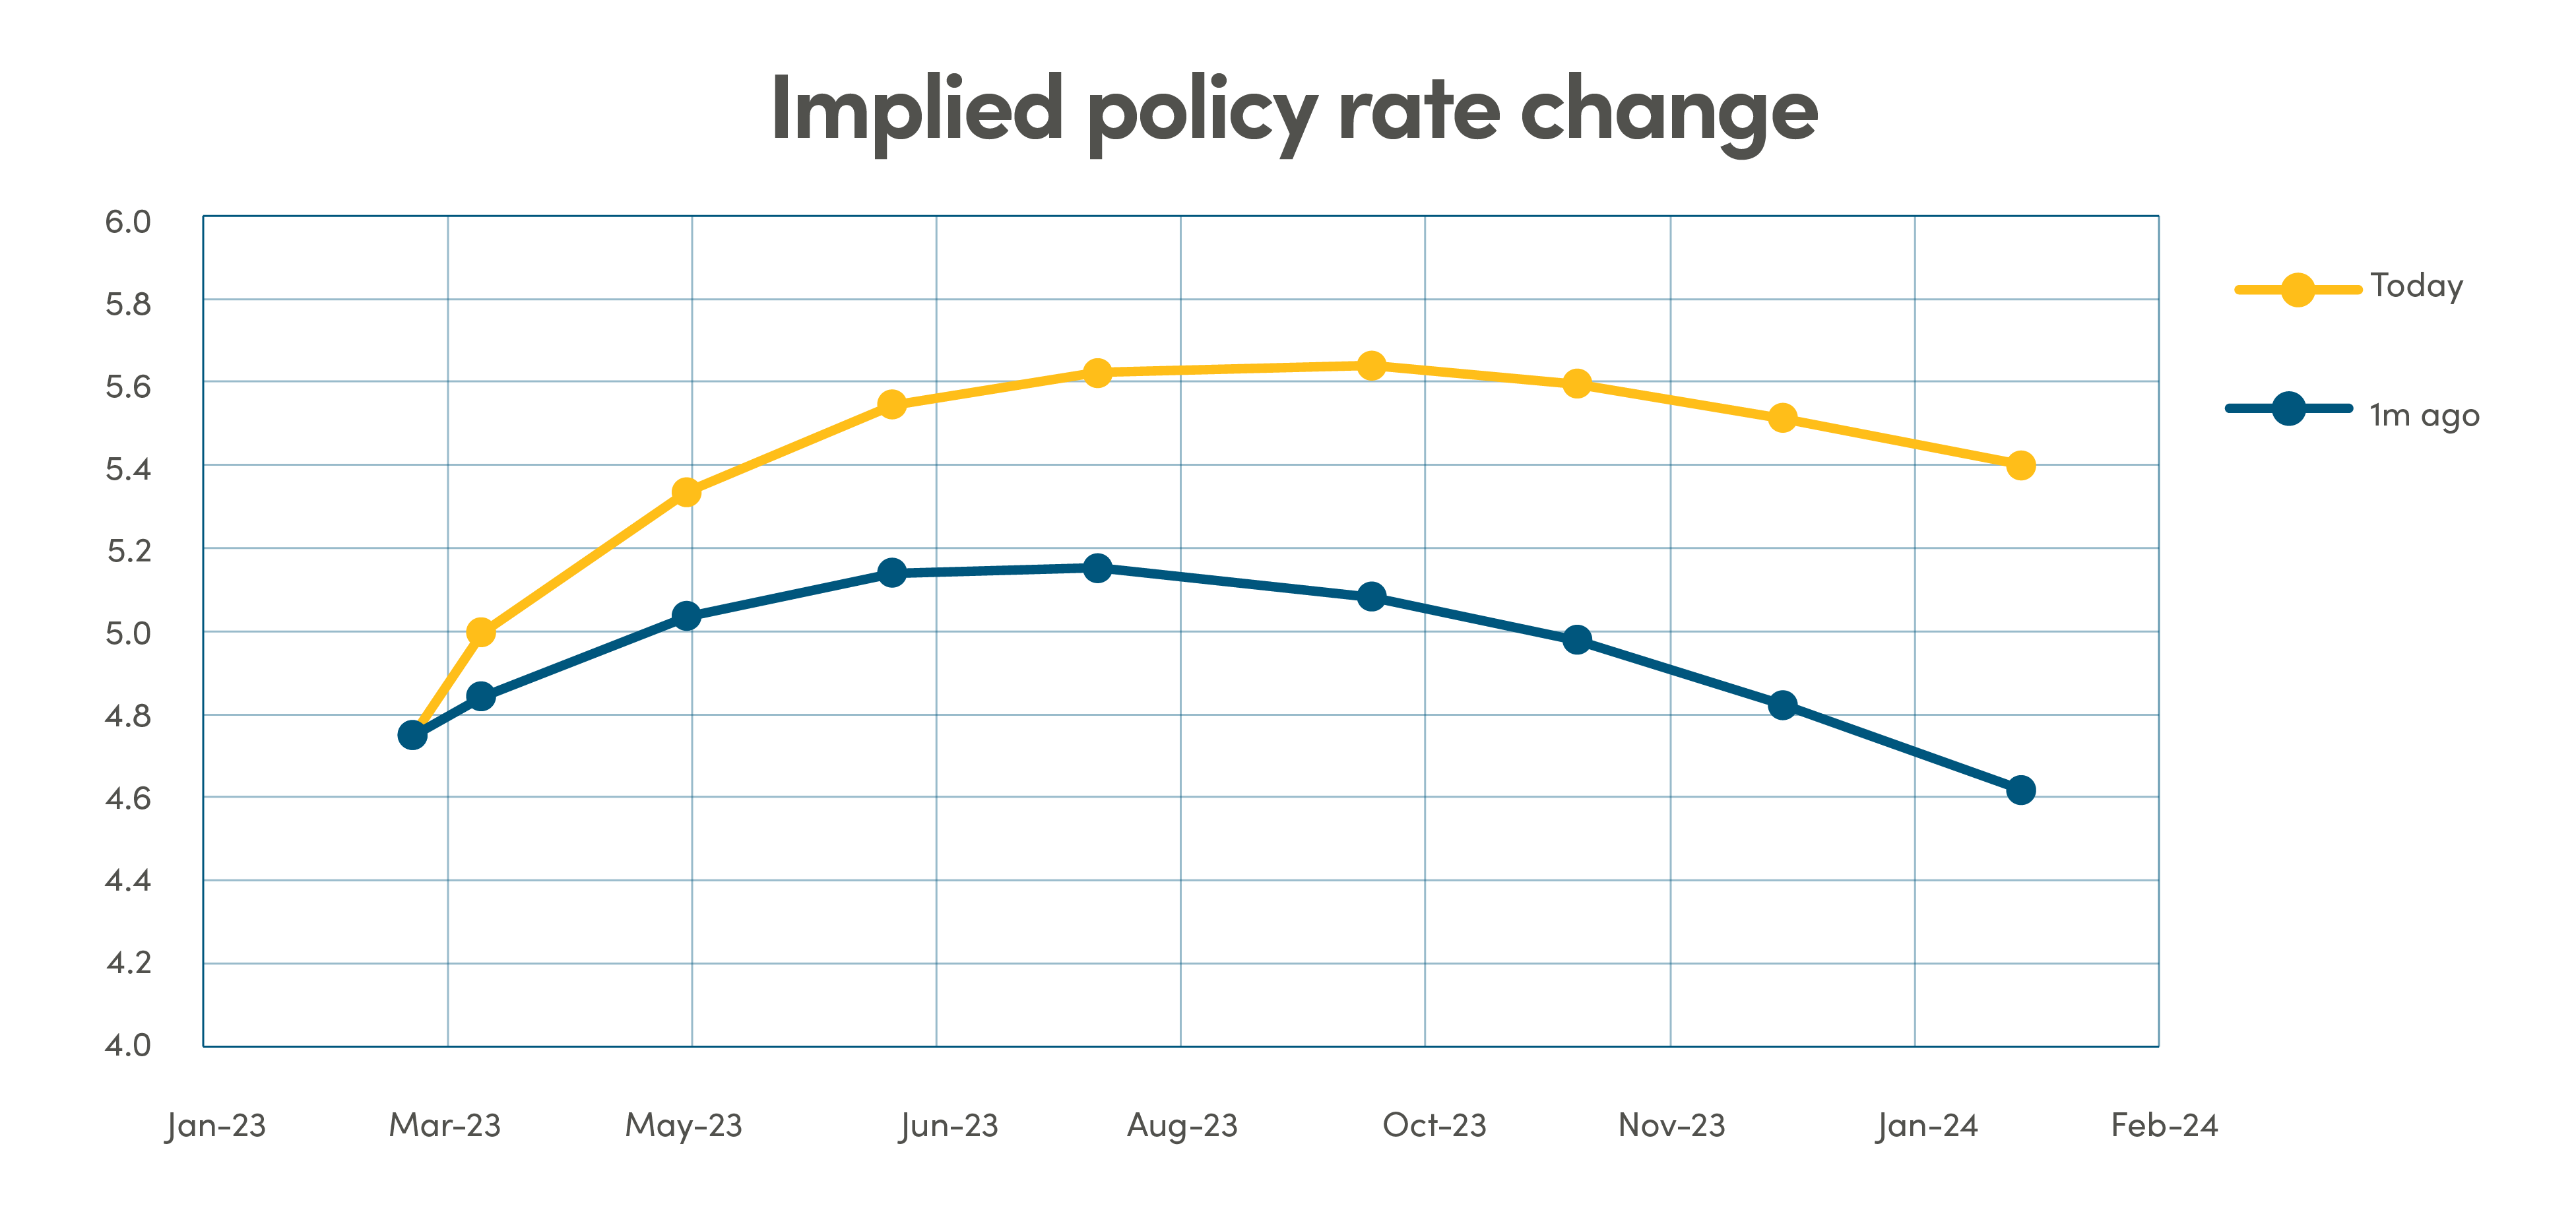
Peak rates moved higher as the Federal Reserve turned more hawkish in February and expressed the need to raise rates higher as the labour market remains tight and inflation is stubborn. The expectation for peak rates in the US moved much higher to over 5.5% in June 2023 and will likely remain above 5% through early 2024.
From NEI’s Monthly Market Monitor for February.

Canada: MSCI Canada; U.S.: MSCI USA; International markets: MSCI EAFE; Emerging markets: MSCI Emerging Markets. Source: Morningstar Direct

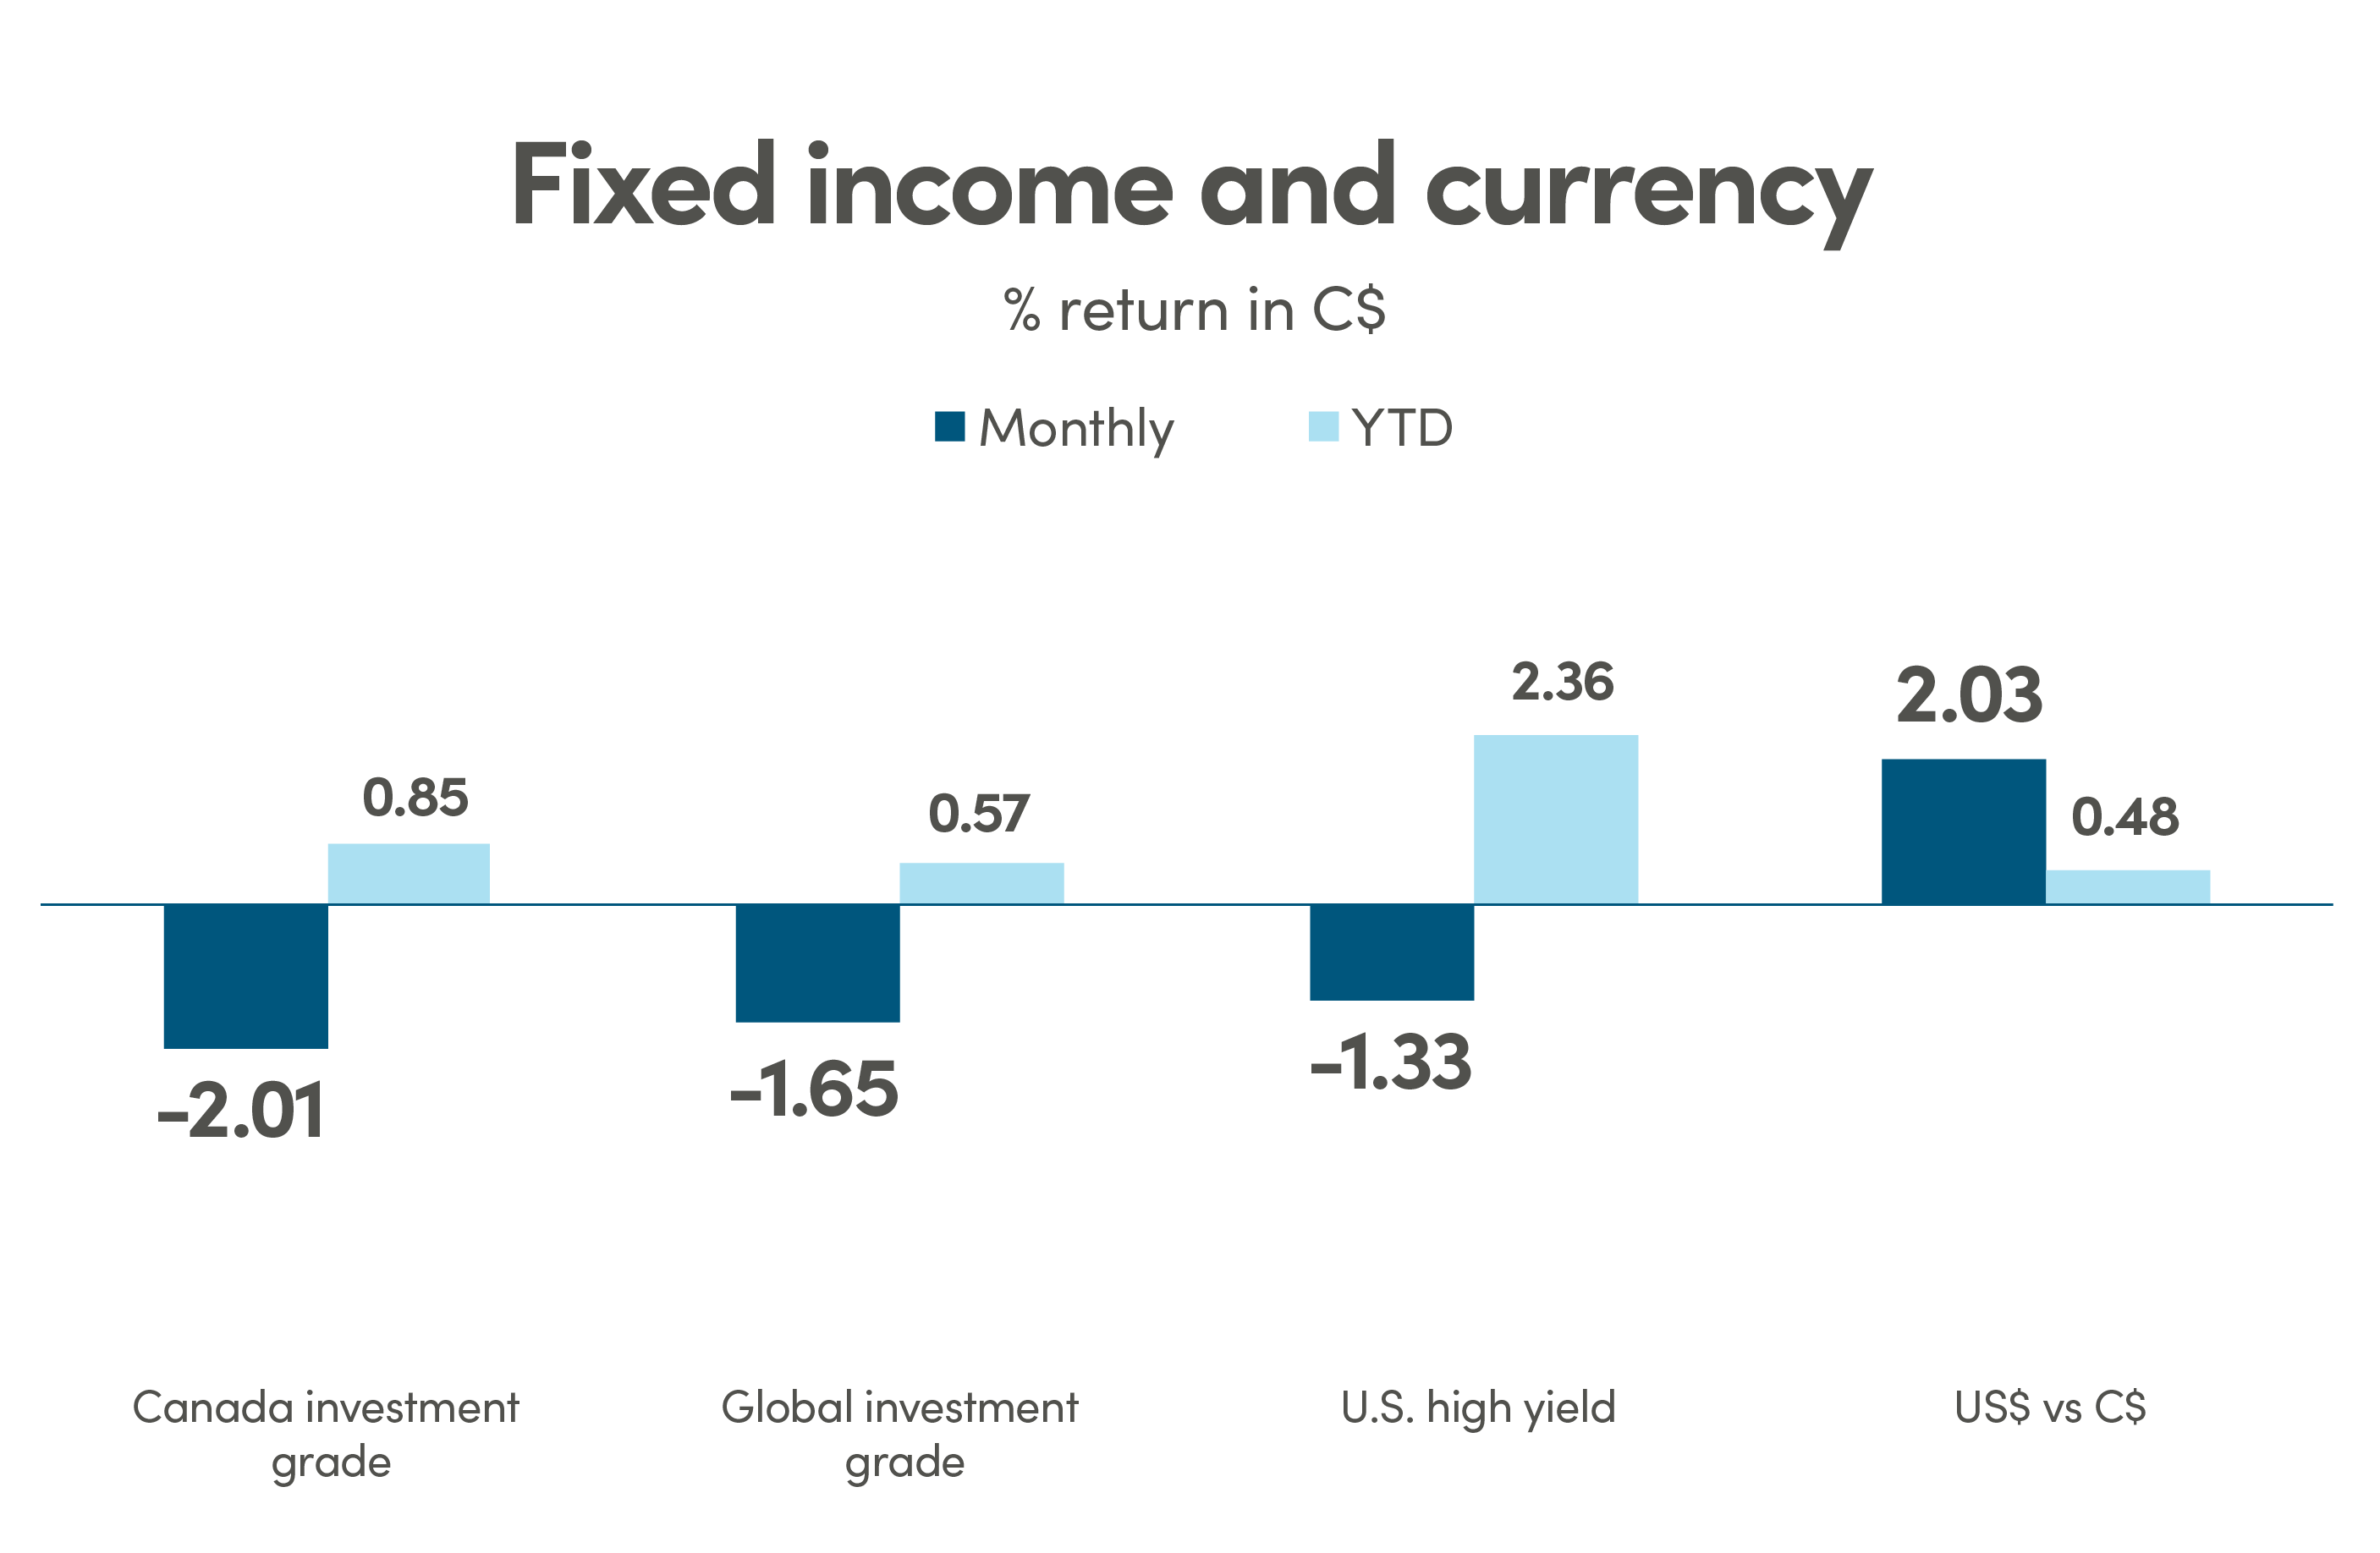
Canada investment grade: Bloomberg Barclays Canada Aggregate; Global investment grade: Bloomberg Barclays Global Aggregate; U.S. high yield: Bloomberg Barclays U.S. High Yield. Source: Morningstar Direct.
Lower risk of recession in the near term
The narrative around recession continues to evolve. Despite heightened probability of recession, economies continue to show resilience and unexpected pockets of strength. The soft-landing/hard-landing narrative has been usurped by the potential for a “no-landing” scenario, the word-of-the-month for economists in February, which points to continued but anemic economic growth, a low unemployment rate and moderating inflation.
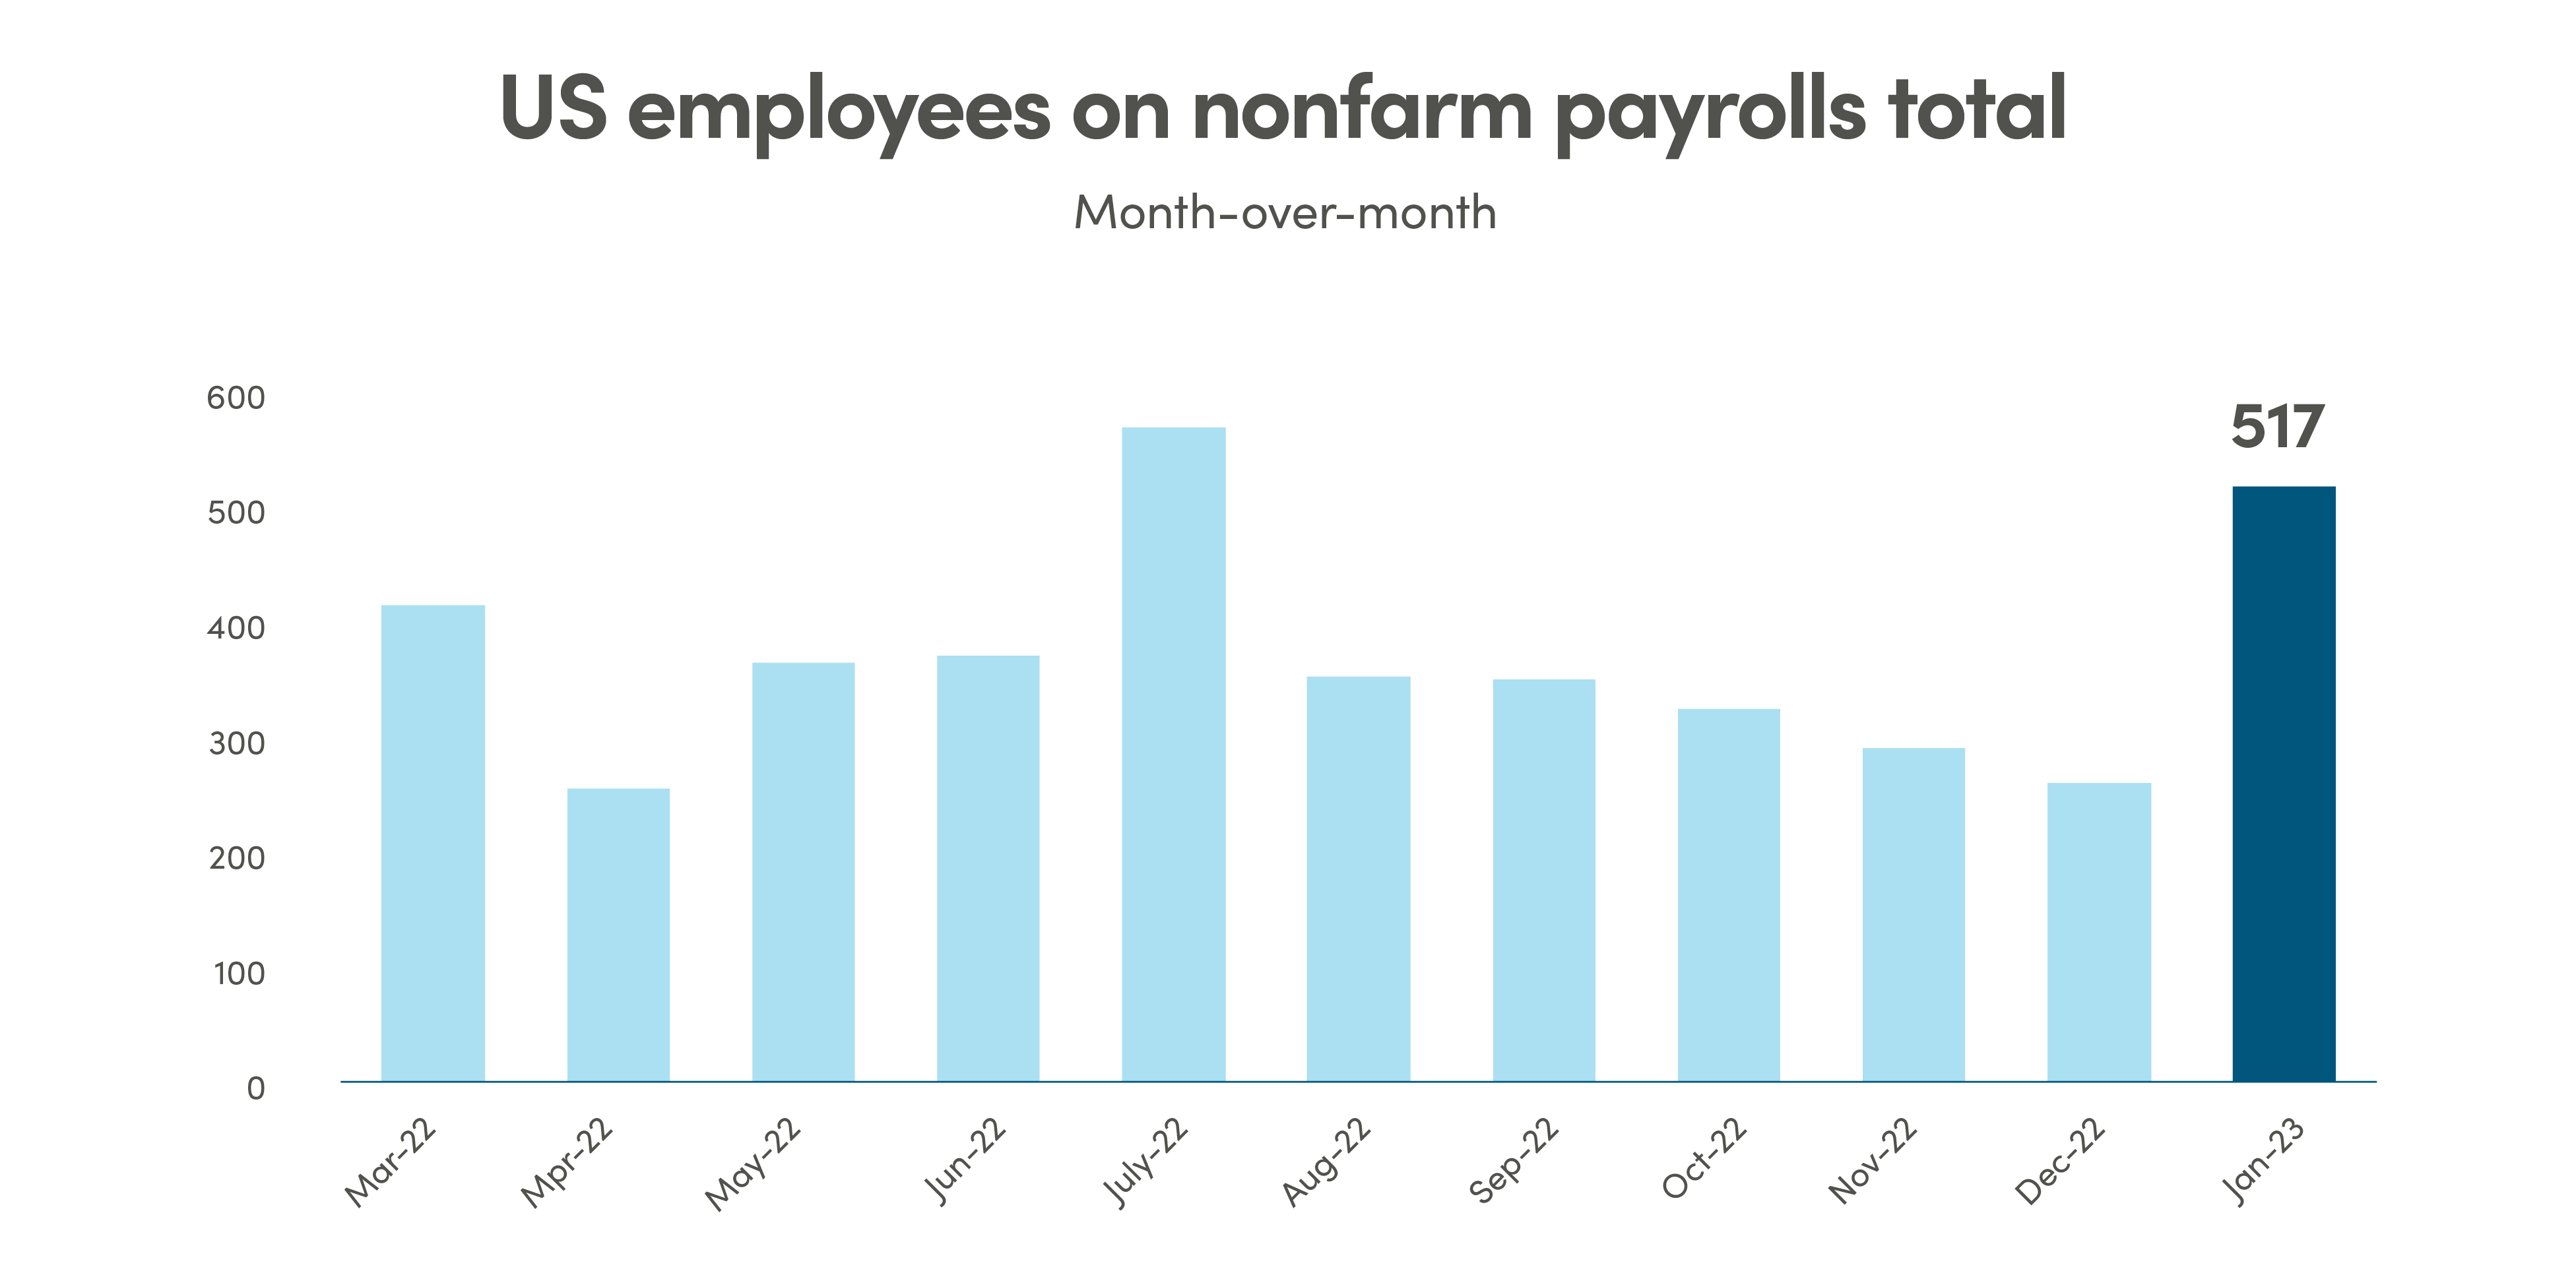
Recent data shows that the labour market remains tight as January’s US Non-Farm Payrolls were blowout numbers with 517,000 jobs added, much stronger than expectation at 187,000 jobs. Jobless claims and initial jobless were both below expectation.

Source: Bloomberg data as of February 28, 2023
The warmer than usual winter and China’s re-opening are clearly a boost to global economy, especially in service industries. The latest Service PMI indices across US, Europe and UK have bounced past 50.0 back into the expansionary territory, demonstrating remarkable resilience. That is, however, also putting more pressure on service inflation. ISM Services Prices Paid Index in the US continues to retreat from peak of mid 80s but remains elevated at 65.
Uptick in inflation may push peak rates higher
Globally inflation has been cooling since it peaked in early 2022 partly due to falling energy prices, partly due to prices of durable goods as the supply chain continued to heal. However, January’s inflation data surprised to the upside in the US, Germany, and Japan, with pick up in spending on goods and services, including motor vehicles, food services, and accommodation. While consumer demand for goods is starting to fall in the U.S, consumption of services is still above trend. The combination of jobs gains, higher consumer demand, and rising wages will continue to put pressures on service inflation.
With tight labour markets and stubborn inflation, the Federal Reserve has, towards the end of the month, doubled down on their hawkish rhetoric and expressed the need to raise rates further. Bond markets sold off quickly, 10-year government yield rallied from a low of 3.39% in early February to end the month at 3.92%. The expectation for peak rate in the US also moved much higher, from under 5% to over 5.5% in June 2023. The market no longer expects meaningful rate cuts by the Federal Reserve in 2023. Current expectations are for rates to remain above 5% through early 2024. Bank of Canada is the only central bank that is believed to have reached the end of this tightening cycle and is expected to stay on pause till the end of this year.

Source: Bloomberg data as of November 30, 2022
Bank of Canada is the only central bank that is believed to have reached the end of this tightening cycle and is expected to stay on pause till the end of this year.
Earnings estimates continue their downtrend
Earnings estimates for 2023 and 2024 have continued their downward trend since mid-2022. While some companies have been able to surprise with their recent quarterly results, the trend at the overall index levels continues to be downward. Companies have been able to grow revenues enough to offset the drop in margins. Profitability is showing early signs of stabilization, as inflation moderates, and supply chains heal. However, earnings growth is still expected to be anemic given the decline in demand amidst tightening financial conditions, and if layoffs pick up steam. Lower profit margins will also impact future earnings, though profit margins remain relatively stable as producer prices have dropped sharply since their peak.

Legal
Aviso Wealth Inc. (“Aviso”) is the parent company of Aviso Financial Inc. (“AFI”) and Northwest & Ethical Investments L.P. (“NEI”). Aviso and Aviso Wealth are registered trademarks owned by Aviso Wealth Inc. NEI Investments is a registered trademark of NEI. Any use by AFI or NEI of an Aviso trade name or trademark is made with the consent and/or license of Aviso Wealth Inc. Aviso is a wholly-owned subsidiary of Aviso Wealth LP, which in turn is owned 50% by Desjardins Financial Holding Inc. and 50% by a limited partnership owned by the five Provincial Credit Union Centrals and The CUMIS Group Limited.
This material is for informational and educational purposes and it is not intended to provide specific advice including, without limitation, investment, financial, tax or similar matters. This document is published by AFI and unless indicated otherwise, all views expressed in this document are those of AFI. The views expressed herein are subject to change without notice as markets change over time. Views expressed regarding a particular industry or market sector should not be considered an indication of trading intent of any funds managed by NEI Investments. Forward-looking statements are not guaranteed of future performance and risks and uncertainties often cause actual results to differ materially from forward-looking information or expectations. Do not place undue reliance on forward-looking information. Mutual funds and other securities are offered through Aviso Financial Inc. Commissions, trailing commissions, management fees and expenses all may be associated with mutual fund investments. Please read the prospectus before investing. Unless otherwise stated, mutual fund securities and cash balances are not insured nor guaranteed, their values change frequently and past performance may not be repeated.
The MSCI information may only be used for your internal use, may not be reproduced or re-disseminated in any form and may not be used as a basis for or a component of any financial instruments or products or indices. None of the MSCI information is intended to constitute investment advice or a recommendation to make (or refrain from making) any kind of investment decision and may not be relied on as such. Historical data and analysis should not be taken as an indication or guarantee of any future performance, analysis, forecast or prediction. The MSCI information is provided on an “as is” basis and the user of this information assumes the entire risk of any use made of this information. MSCI, each of its affiliates and each other person involved in or related to computing, computing or creating any MCI information (collectively, the “MSCI Parties”) expressly disclaims all warranties (including, without limitation, any warranties of originality, accuracy, completeness, timeliness, non-infringement, merchantability and fitness for a particular purpose) with respect to this information. Without limiting any of the foregoing, in no event shall any MSCI Party have any liability for any direct, indirect, special, incidental, punitive, consequential (including, without limitation, lost profits) or any other damages.