October 2023 monthly market insights
Data and opinions as of September 30, 2023
September lives up to its reputation
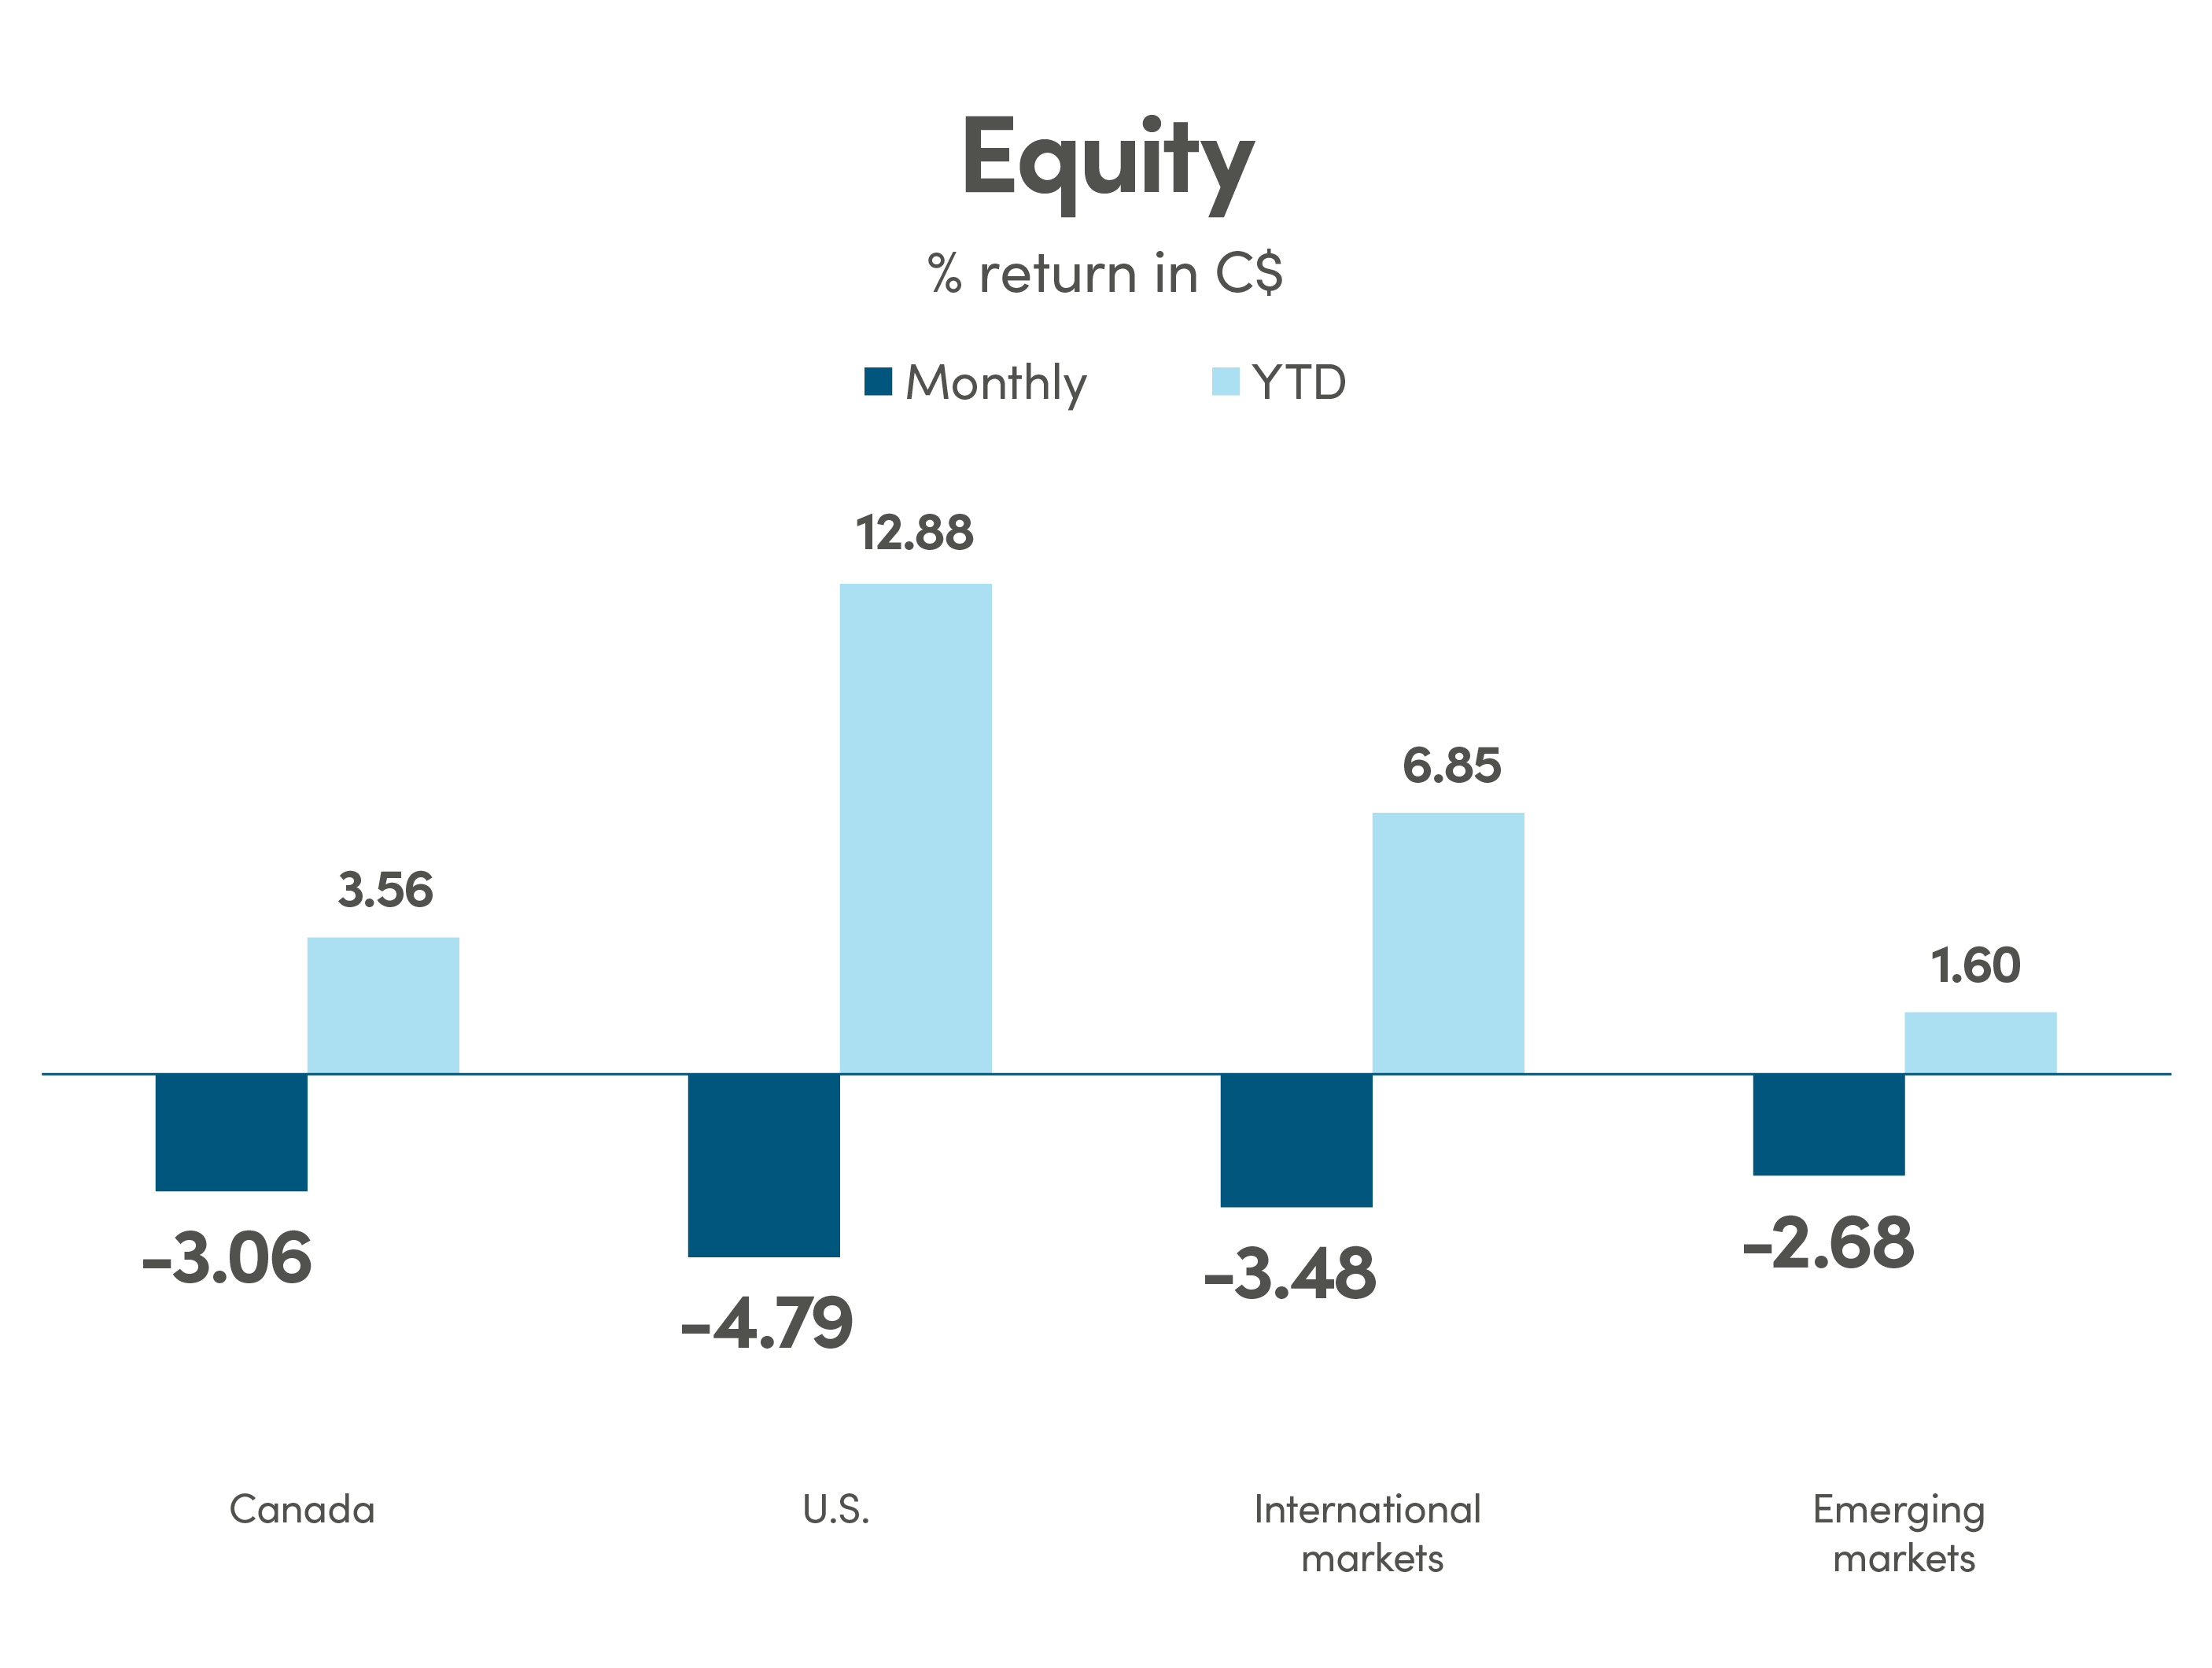
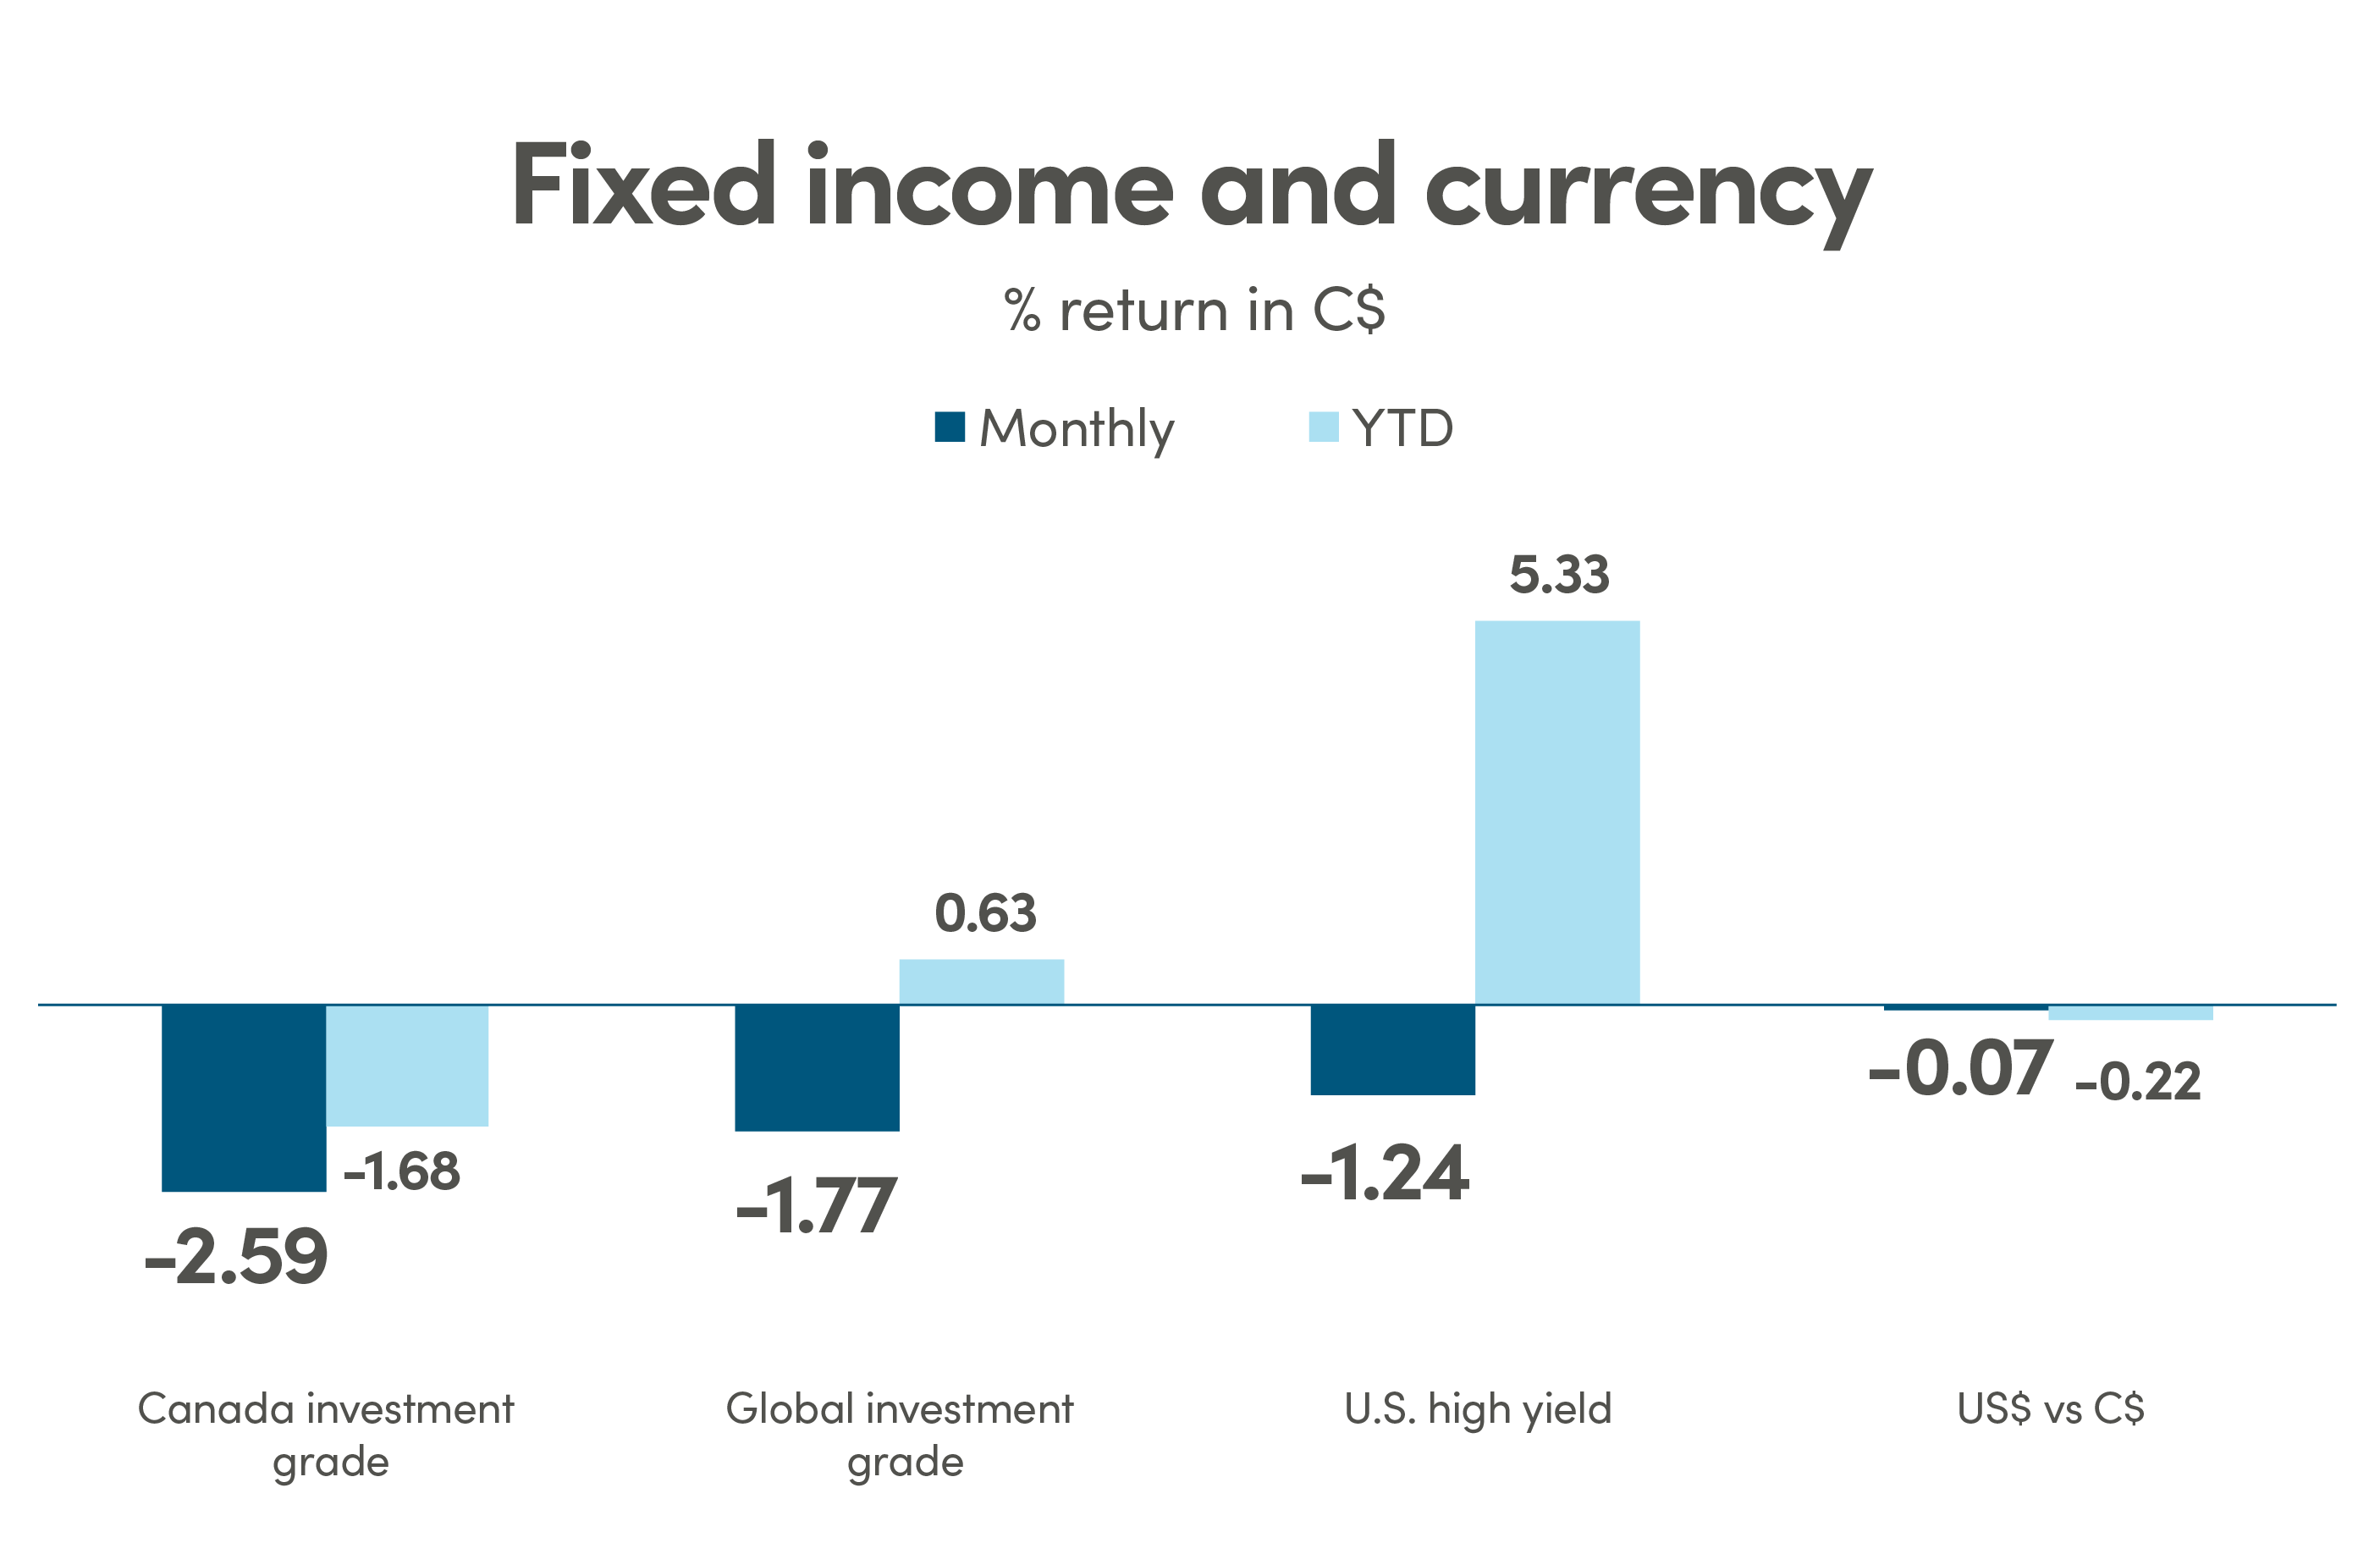
September lived up to its reputation for being a historically challenging month for markets, as both equity and bond markets saw their worst declines of the year. The S&P 500 Index was down 4.9% in September— its second monthly decline in a row, while the Nasdaq was down 5.8%. Canadian markets did not fare much better than their U.S. peers, with the TSX falling 3.7% for the month. In September, investors’ focus shifted from whether there will be another hike in the near term, to how long rates will be held at restrictive levels. The prevailing narrative is that interest rates will remain “higher for longer” as central banks continue to indicate restrictive rates to be necessary for some time to tame inflationary pressures.
The NEI perspective
Growth trends diverge between regions as the U.S. economy looks the most resilient despite some areas of slowing growth, while Canada has a higher risk of a recession as GDP slows, and Europe appears to be headed for recession as economic data continues to surprise to the downside.
Inflation to recede by year-end as year-over-year Consumer Price Index data continues to fall in Canada, the U.S. and Europe, plus higher energy prices are beginning to reduce consumer spending in other areas.
Rates likely to remain “higher for longer” as the Fed’s latest meeting showed a revised dot plot reflecting minimal interest rate cuts starting in 2024. The bond market has also been adjusting to this narrative as yields on the 10-year U.S. Treasuries soared up to 4.6% in September, a level not seen since 2007.
From NEI’s Monthly Market Monitor for September.

Canada: MSCI Canada; U.S.: MSCI USA; International markets: MSCI EAFE; Emerging markets: MSCI Emerging Markets. Source: Morningstar Direct

Canada investment grade: Bloomberg Barclays Canada Aggregate; Global investment grade: Bloomberg Barclays Global Aggregate; U.S. high yield: Bloomberg Barclays U.S. High Yield. Source: Morningstar Direct.
U.S. still the most resilient economy but showing signs of slowdown
Although the probability of the U.S. falling into recession in 2023 continues to fall, there are nevertheless some signs of slowdown and moderation in the U.S. economy.
Higher interest expenses are starting to weigh on companies as the strengthening U.S. dollar and rising interest rates have contributed to tighter financial conditions in the U.S. economy, as indicated by the financial conditions index crossing into restrictive territory, which can weigh on growth in the near term.
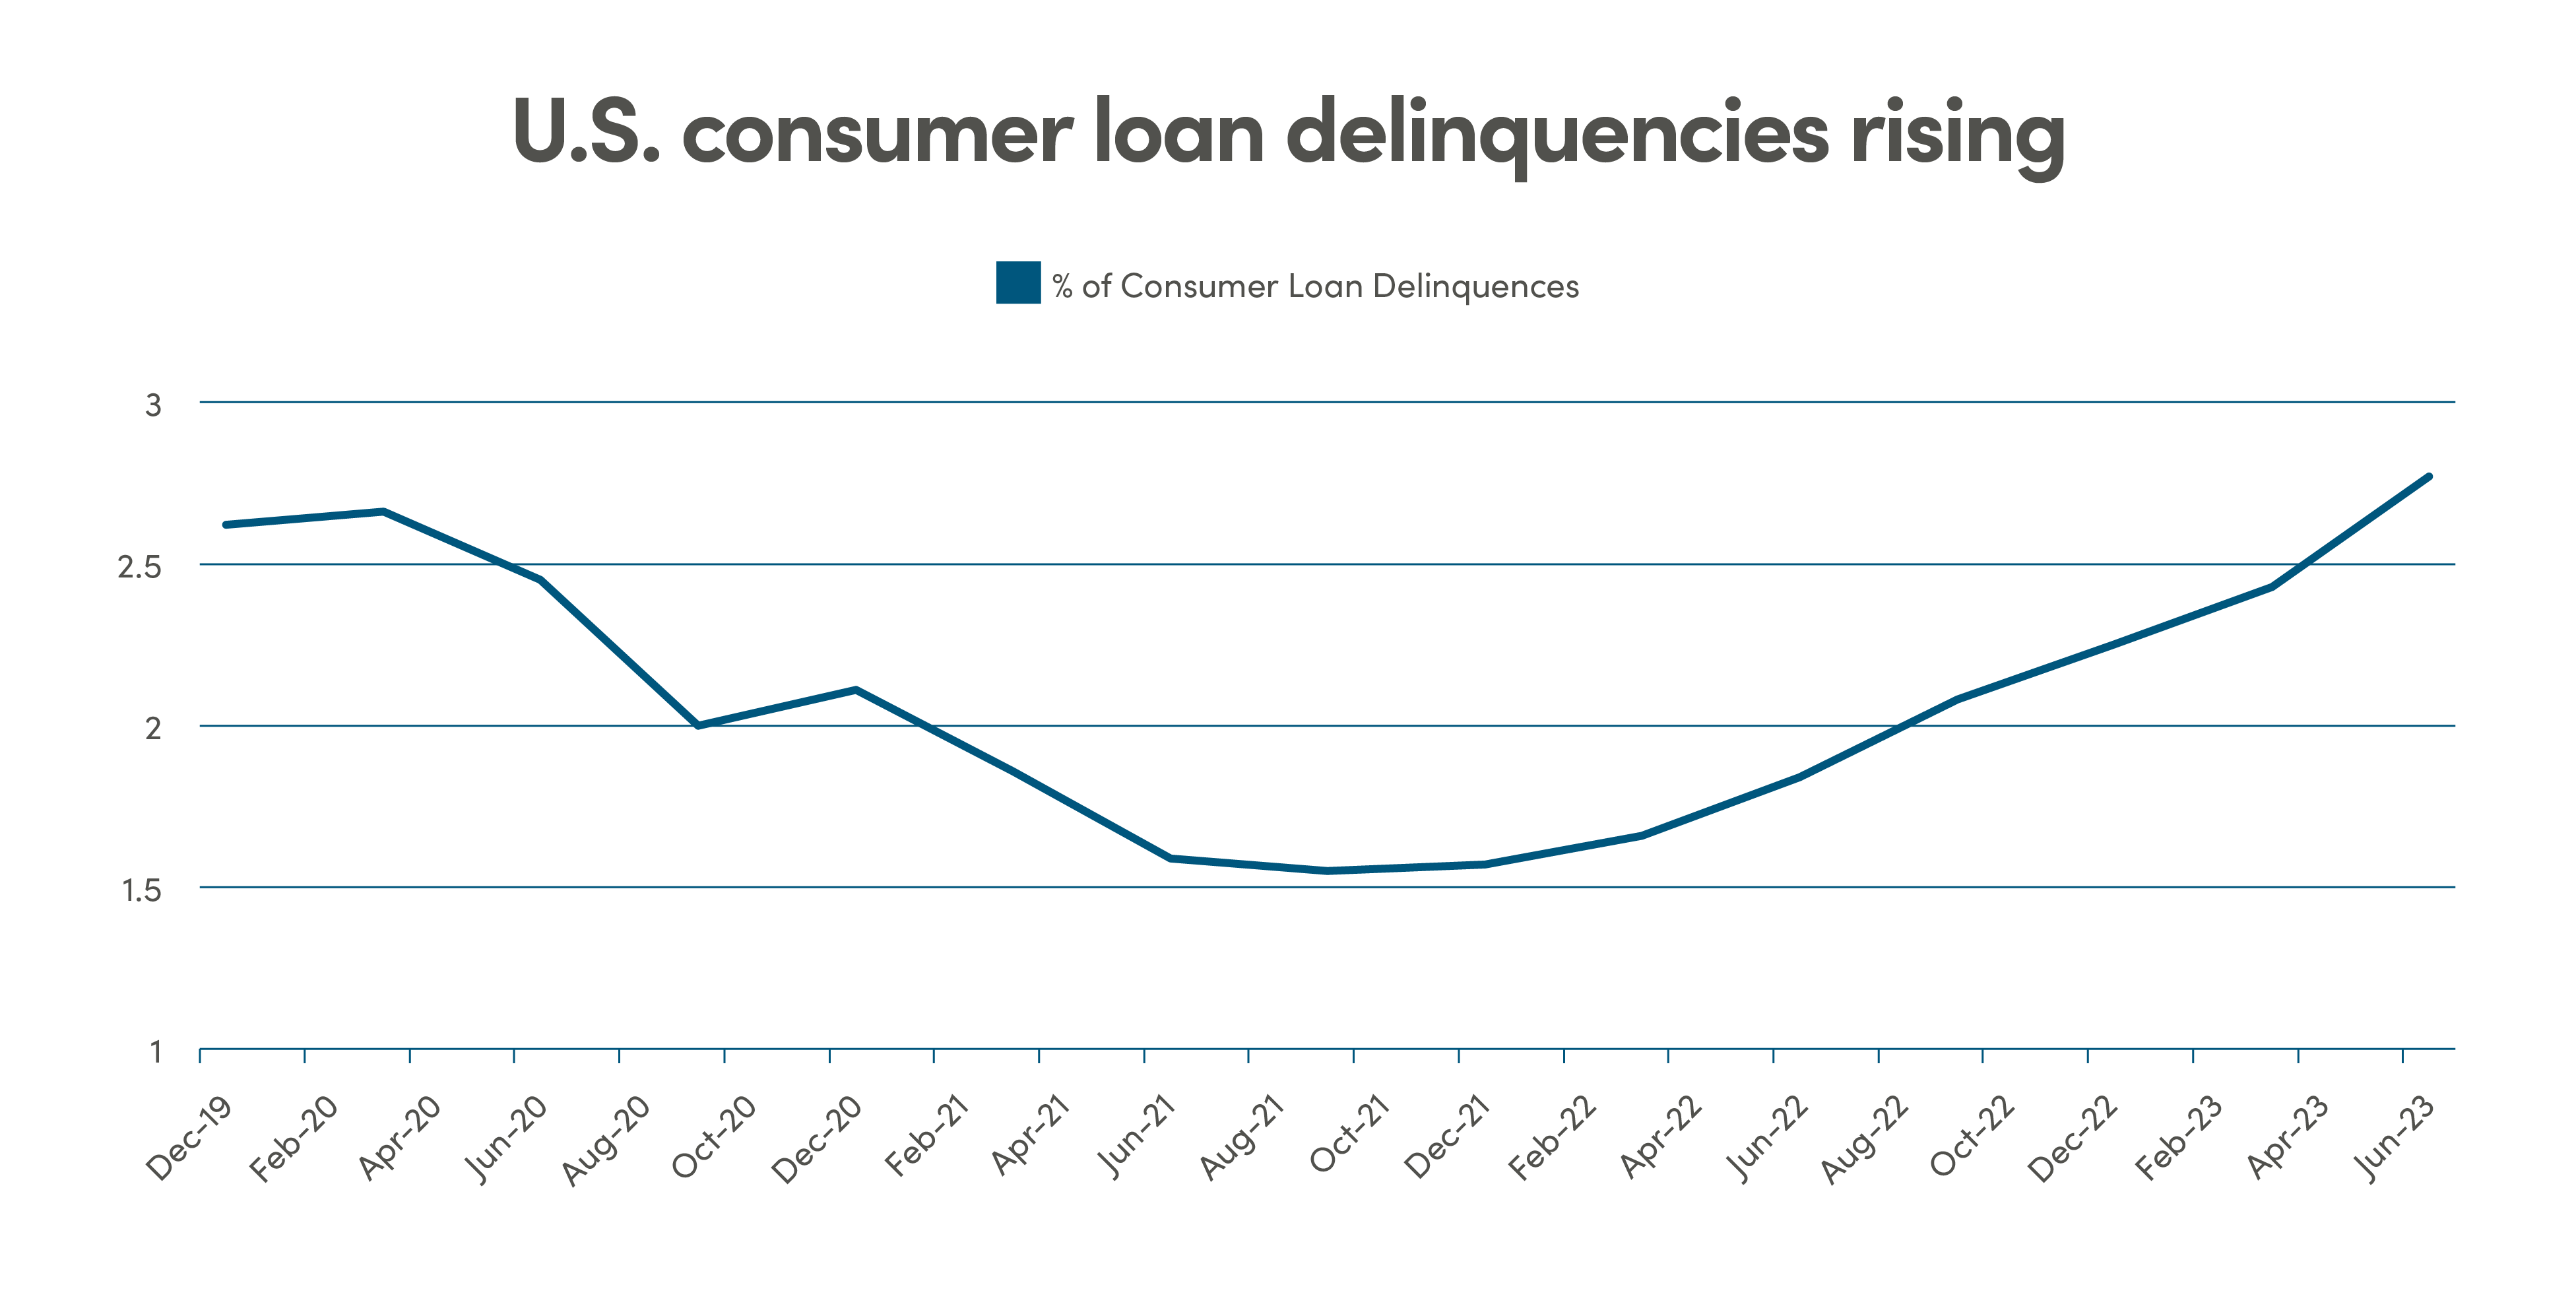
There is growing evidence that suggests that consumption will slow as well. The excess savings that have largely been responsible for the resilience of consumers is expected to be mostly depleted by the end of the year, and as this buffer erodes, consumer spending will begin to slow down. Additionally, with the resumption of student loan repayments, consumers are starting to feel the squeeze. With an uptick in credit card and auto loan delinquencies, the resilience of consumers is starting to wane, and they will be less of a tailwind to economic growth going forward.

Source: Source: Bloomberg data as of September 30, 2023
Recession risk rising in Canada
While the U.S. has greater prospects of making a soft landing, recession risk in Canada is rising. The economy has entered a period of weaker growth, with a marked weakening in consumption and a contraction in manufacturing activity. The disruption caused by wildfires in June likely also played a role in the most recent contraction in Q2 GDP.
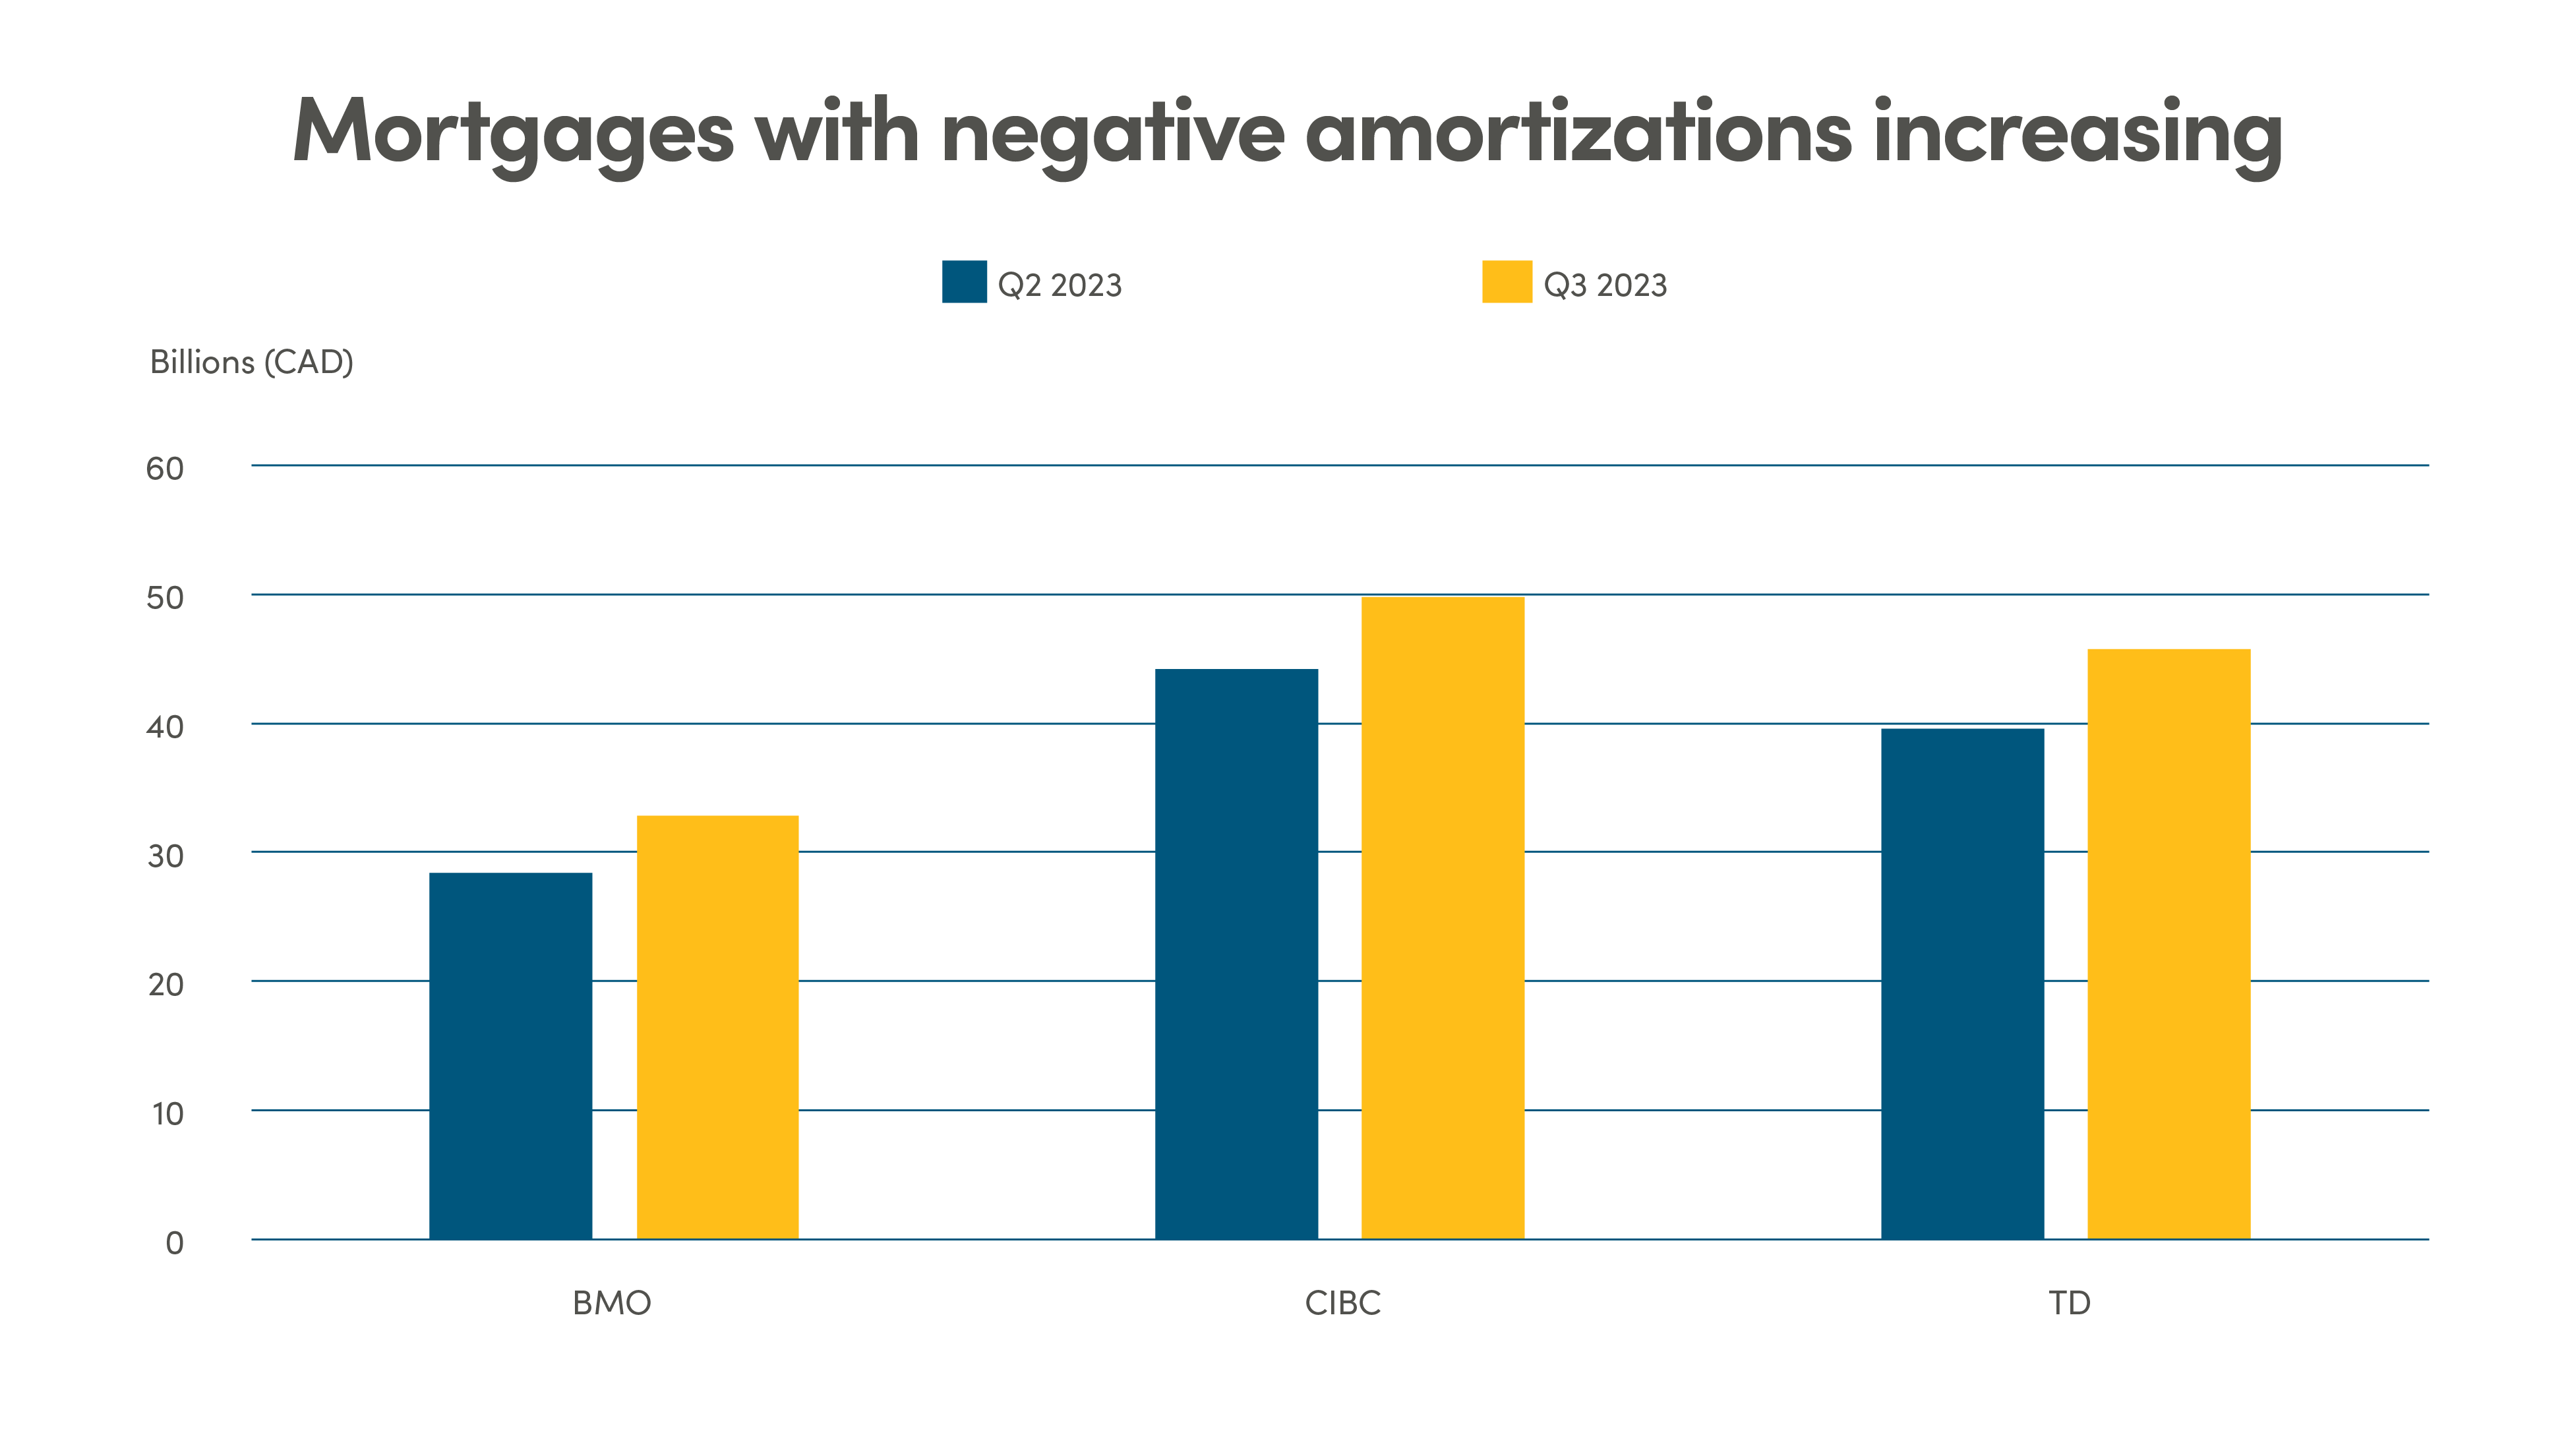
This weakening in consumption could be indicating that Canadian consumers are starting to feel the weight of tighter monetary policies. With more mortgages in shorter terms and variable rates, there is greater evidence that rising mortgage payments are impacting Canadian consumers. A key risk being watched by banks and regulators is the rising number of mortgages in negative amortization, a situation when monthly mortgage payments are no longer enough to cover interest payments.
Statistics from big Canadian banks' Q3 2023 earnings reports show that negative amortizations make up 22% of BMO’s total mortgage portfolio, 19% of CIBC’s total mortgage portfolio and 18% of TD’s mortgage portfolio, but minimally in RBC and Scotiabank. Mortgages with negative amortizations have been rising alarmingly during the last quarter. This could lead to the continuation of weaker consumer spending in Canada so long as the monetary policy stays restrictive.

Source: Canadian Bank Q3 financial reports, NEI Investments
Foreign investors bullish on Japan
Recent months have seen a chorus of bullish calls on Japanese equities and a surge in overseas investor interest, pushing the main indices back to levels not seen since 1989. This growth is attributed to the late reopening of Japan’s economy after the COVID-19 pandemic, leading to confidence in corporate earnings and attractive stock valuations. Additionally, the Tokyo Stock Exchange's call for companies to focus on sustainable growth and raising their price-to-book ratios has also played a role. These factors have led to increased foreign investments as the Japanese market displayed attractive valuation metrics relative to the rest of the world, though the weakening yen has limited gains for overseas investors.

Legal
Aviso Wealth Inc. (“Aviso”) is the parent company of Aviso Financial Inc. (“AFI”) and Northwest & Ethical Investments L.P. (“NEI”). Aviso and Aviso Wealth are registered trademarks owned by Aviso Wealth Inc. NEI Investments is a registered trademark of NEI. Any use by AFI or NEI of an Aviso trade name or trademark is made with the consent and/or license of Aviso Wealth Inc. Aviso is a wholly-owned subsidiary of Aviso Wealth LP, which in turn is owned 50% by Desjardins Financial Holding Inc. and 50% by a limited partnership owned by the five Provincial Credit Union Centrals and The CUMIS Group Limited.
This material is for informational and educational purposes and it is not intended to provide specific advice including, without limitation, investment, financial, tax or similar matters. This document is published by AFI and unless indicated otherwise, all views expressed in this document are those of AFI. The views expressed herein are subject to change without notice as markets change over time. Views expressed regarding a particular industry or market sector should not be considered an indication of trading intent of any funds managed by NEI Investments. Forward-looking statements are not guaranteed of future performance and risks and uncertainties often cause actual results to differ materially from forward-looking information or expectations. Do not place undue reliance on forward-looking information. Mutual funds and other securities are offered through Aviso Financial Inc. Commissions, trailing commissions, management fees and expenses all may be associated with mutual fund investments. Please read the prospectus before investing. Unless otherwise stated, mutual fund securities and cash balances are not insured nor guaranteed, their values change frequently and past performance may not be repeated.
The MSCI information may only be used for your internal use, may not be reproduced or re-disseminated in any form and may not be used as a basis for or a component of any financial instruments or products or indices. None of the MSCI information is intended to constitute investment advice or a recommendation to make (or refrain from making) any kind of investment decision and may not be relied on as such. Historical data and analysis should not be taken as an indication or guarantee of any future performance, analysis, forecast or prediction. The MSCI information is provided on an “as is” basis and the user of this information assumes the entire risk of any use made of this information. MSCI, each of its affiliates and each other person involved in or related to computing, computing or creating any MCI information (collectively, the “MSCI Parties”) expressly disclaims all warranties (including, without limitation, any warranties of originality, accuracy, completeness, timeliness, non-infringement, merchantability and fitness for a particular purpose) with respect to this information. Without limiting any of the foregoing, in no event shall any MSCI Party have any liability for any direct, indirect, special, incidental, punitive, consequential (including, without limitation, lost profits) or any other damages.