September 2023 monthly market insights
Data and opinions as of August 31, 2023
Markets cool off in August
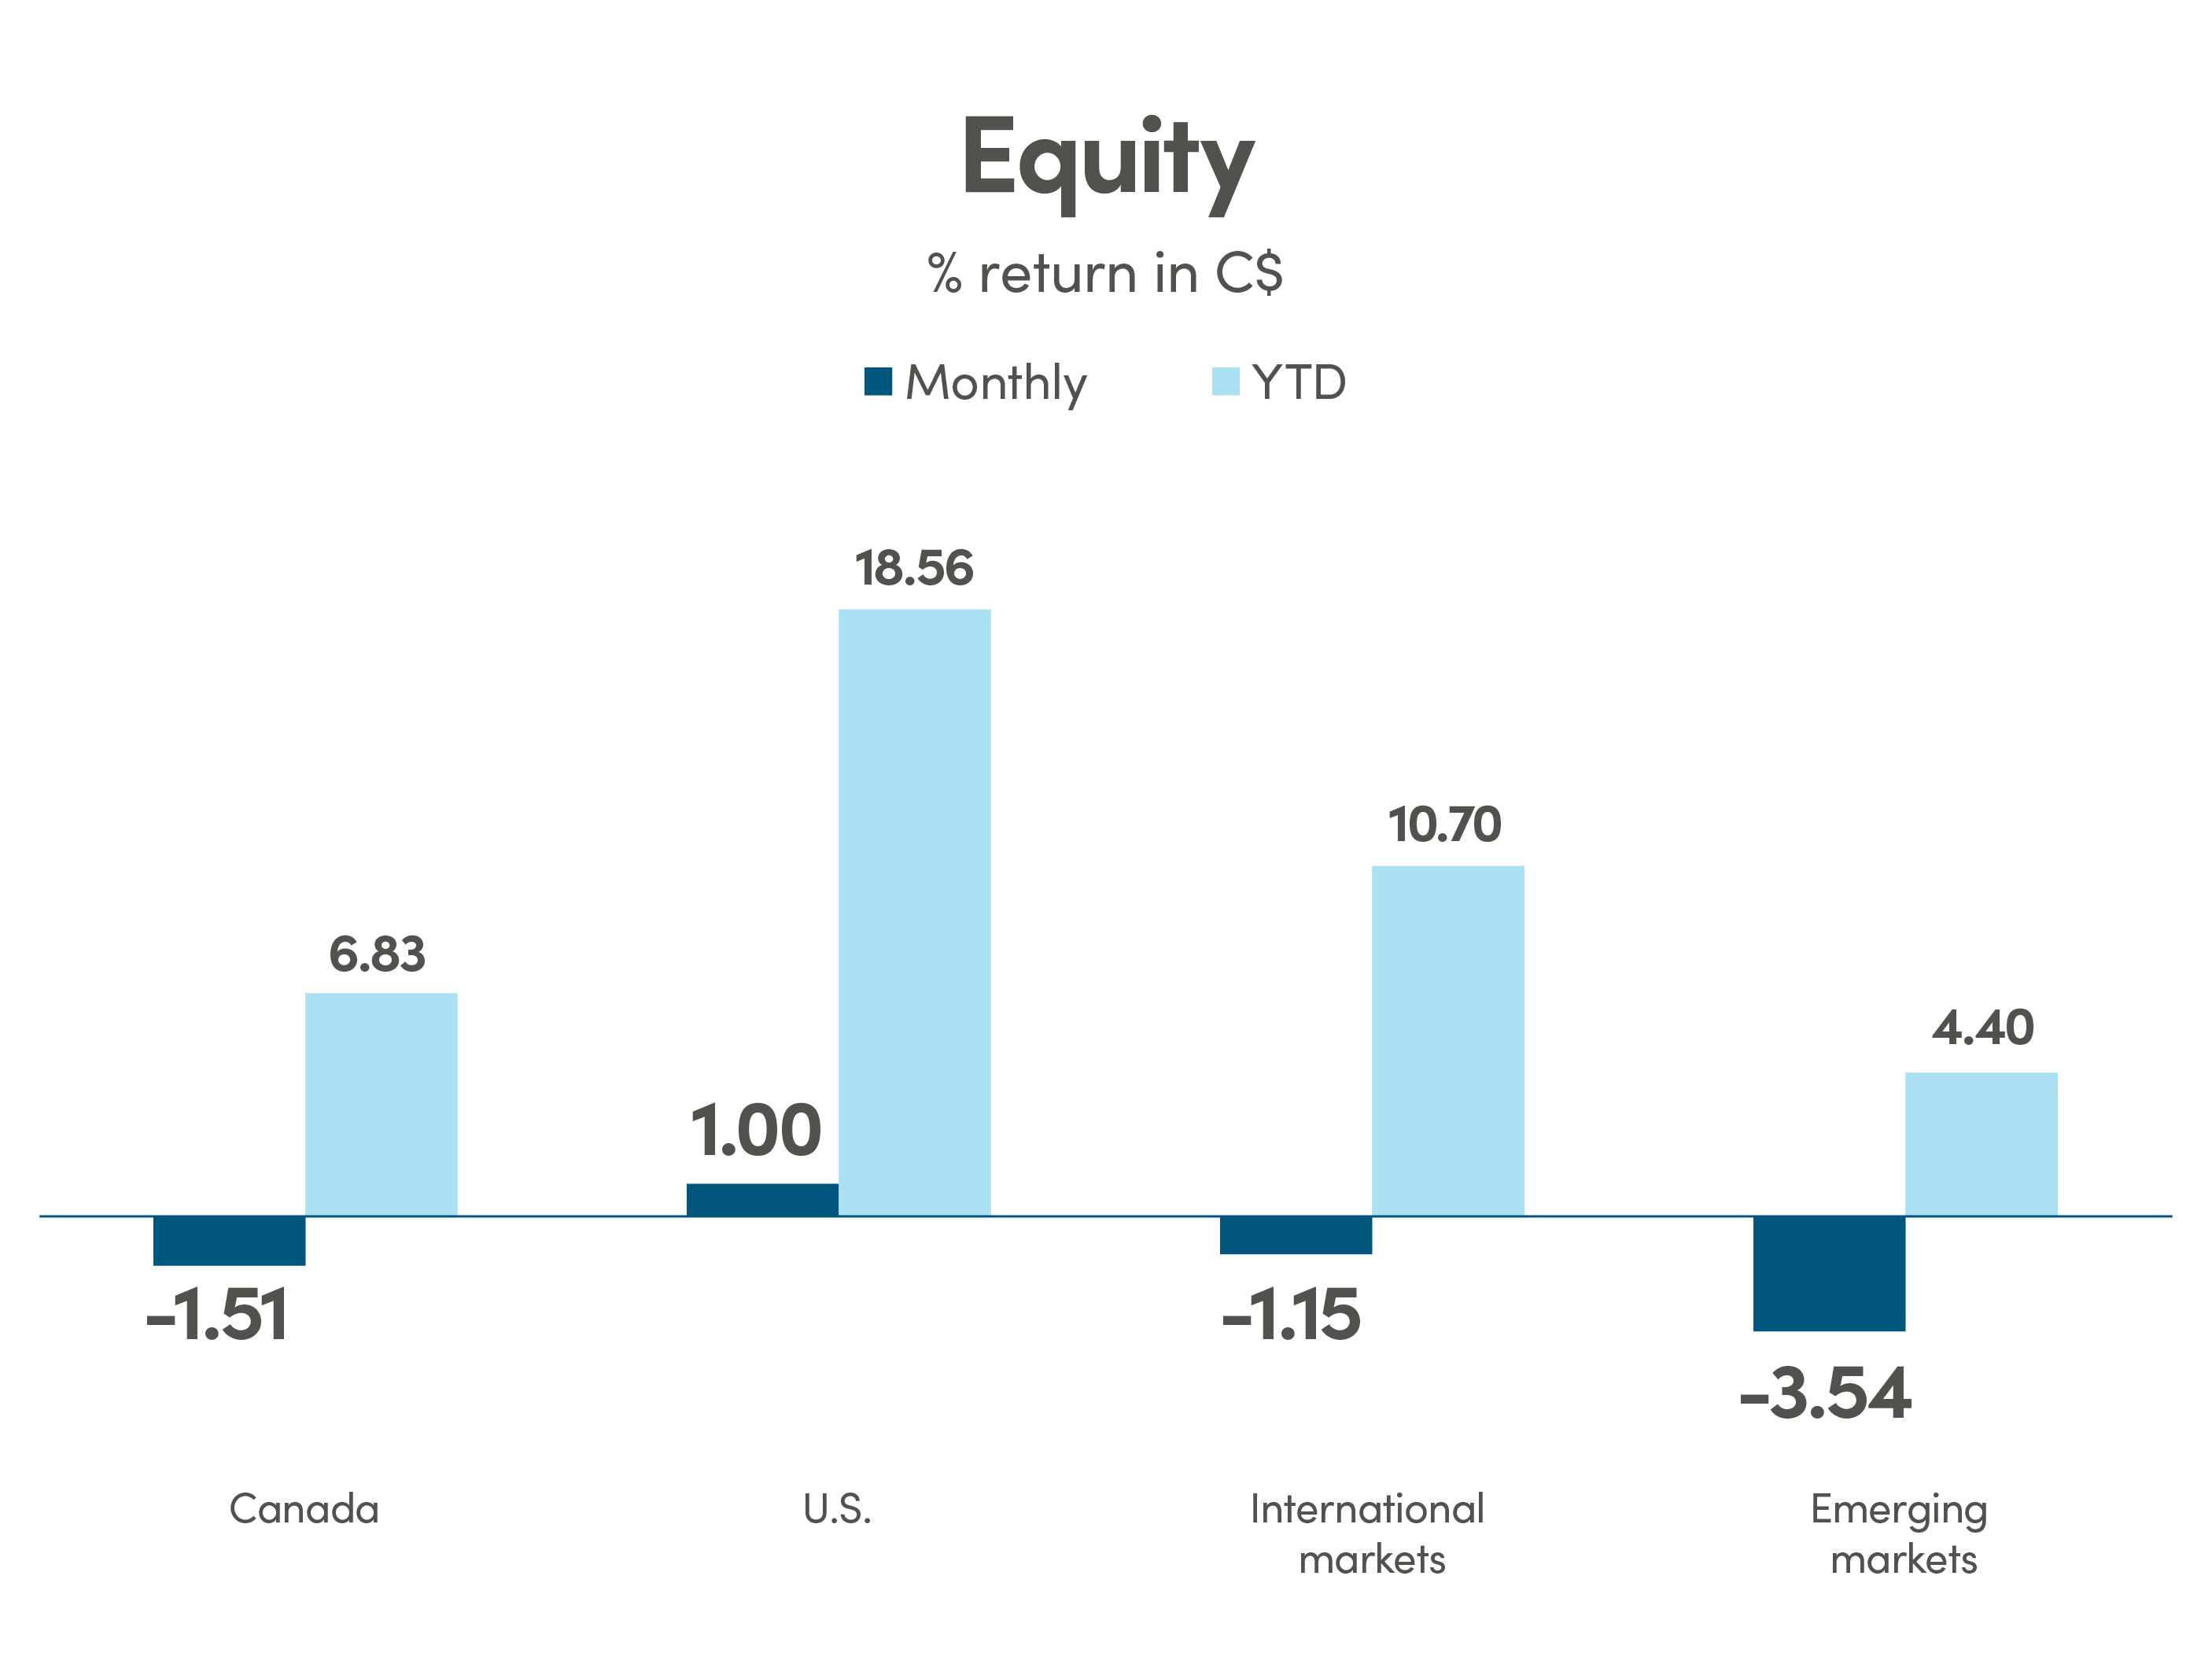
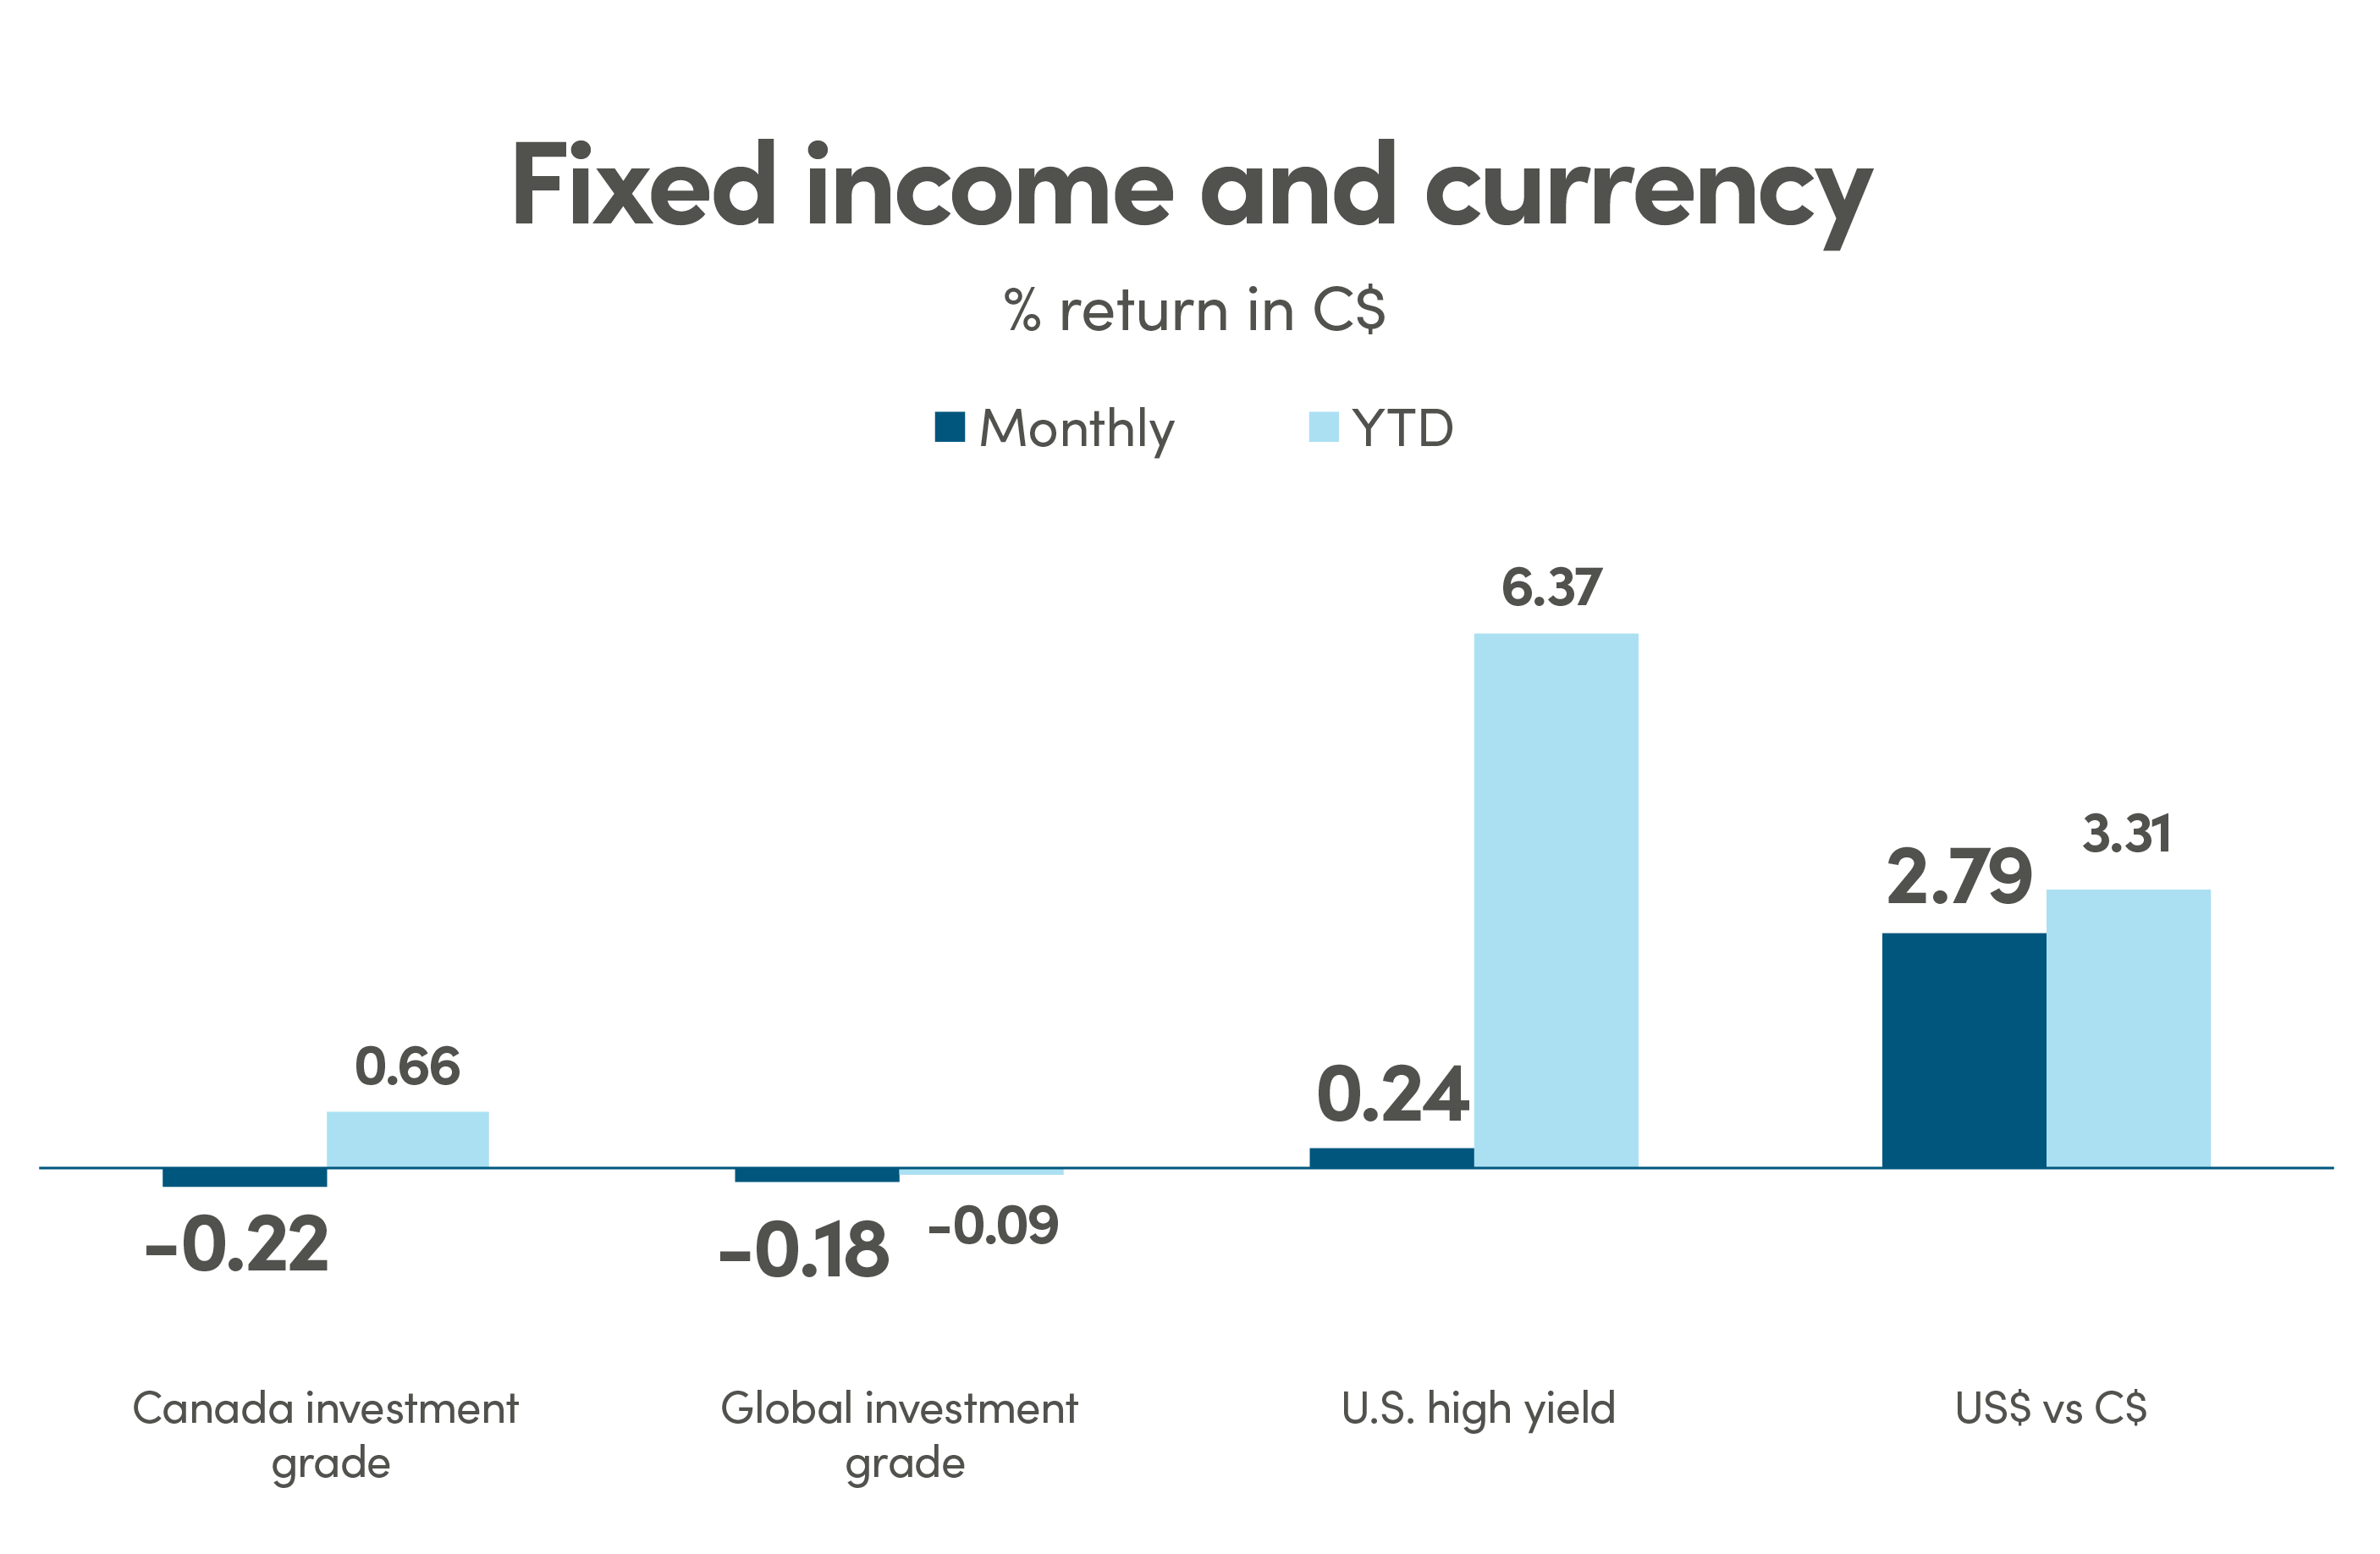
The end of July marked the peak for the S&P 500 so far this year, as the steady market uptrend that began in mid March started to retreat as soon as the August began. Following a 20% S&P 500 Index return in the first seven months of the year, the index fell -1.77% in August. Rising yields and uncertainty surrounding the path of China’s economic recovery were chief concerns among investor in recent weeks, which contributed to a volatile month in global markets. Global stocks sold off through the month with the MSCI All Country World Index declining 2.96% over the month. Developed markets outperformed emerging markets, which lost 3.54% in US dollar terms. Fixed income markets also fell in August as yields rose. Yields on the 10-year US Treasury increased by 15 basis points (bps), to 4.1%.
The NEI perspective
Long bond yields have steadily pushed higher over the past few months even as inflation in the U.S. has fallen from around 9% to just above 3% over the last year. The yield on the 10-year Treasury continued to move up in August, reflecting an ongoing reassessment of the long-run neutral rate of interest.
Investors took profits on the back of stronger than expected Q2 earnings and drove the market lower in August. Price reaction in the few days following positive earnings surprises generally didn’t reward the companies that beat consensus, as earnings outlook and rising long yields weighed on investor sentiment.
Global growth expected to slow as recent data revealed that consumer and business loans weakened and that banks anticipate the ongoing tightening of lending standards to continue in the second half. Plus personal savings rates in the U.S. continue to fall as credit card and auto loan delinquencies are beginning to rise.
From NEI’s Monthly Market Monitor for August.

Canada: MSCI Canada; U.S.: MSCI USA; International markets: MSCI EAFE; Emerging markets: MSCI Emerging Markets. Source: Morningstar Direct

Canada investment grade: Bloomberg Barclays Canada Aggregate; Global investment grade: Bloomberg Barclays Global Aggregate; U.S. high yield: Bloomberg Barclays U.S. High Yield. Source: Morningstar Direct.
Profit taking on strong second quarter earnings
Second quarter earnings for most companies widely beat consensus estimates which were set at a very low bar prior to the start of the quarter. Given the equity market performance this year, the low bar that was set, and the valuations, a bigger driver for market valuations was the forward-looking earnings growth guidance. As a result, price reaction in the few days following positive earnings surprises generally didn’t reward the companies that beat consensus, as earnings outlook and rising long yields weighed on investor sentiment.
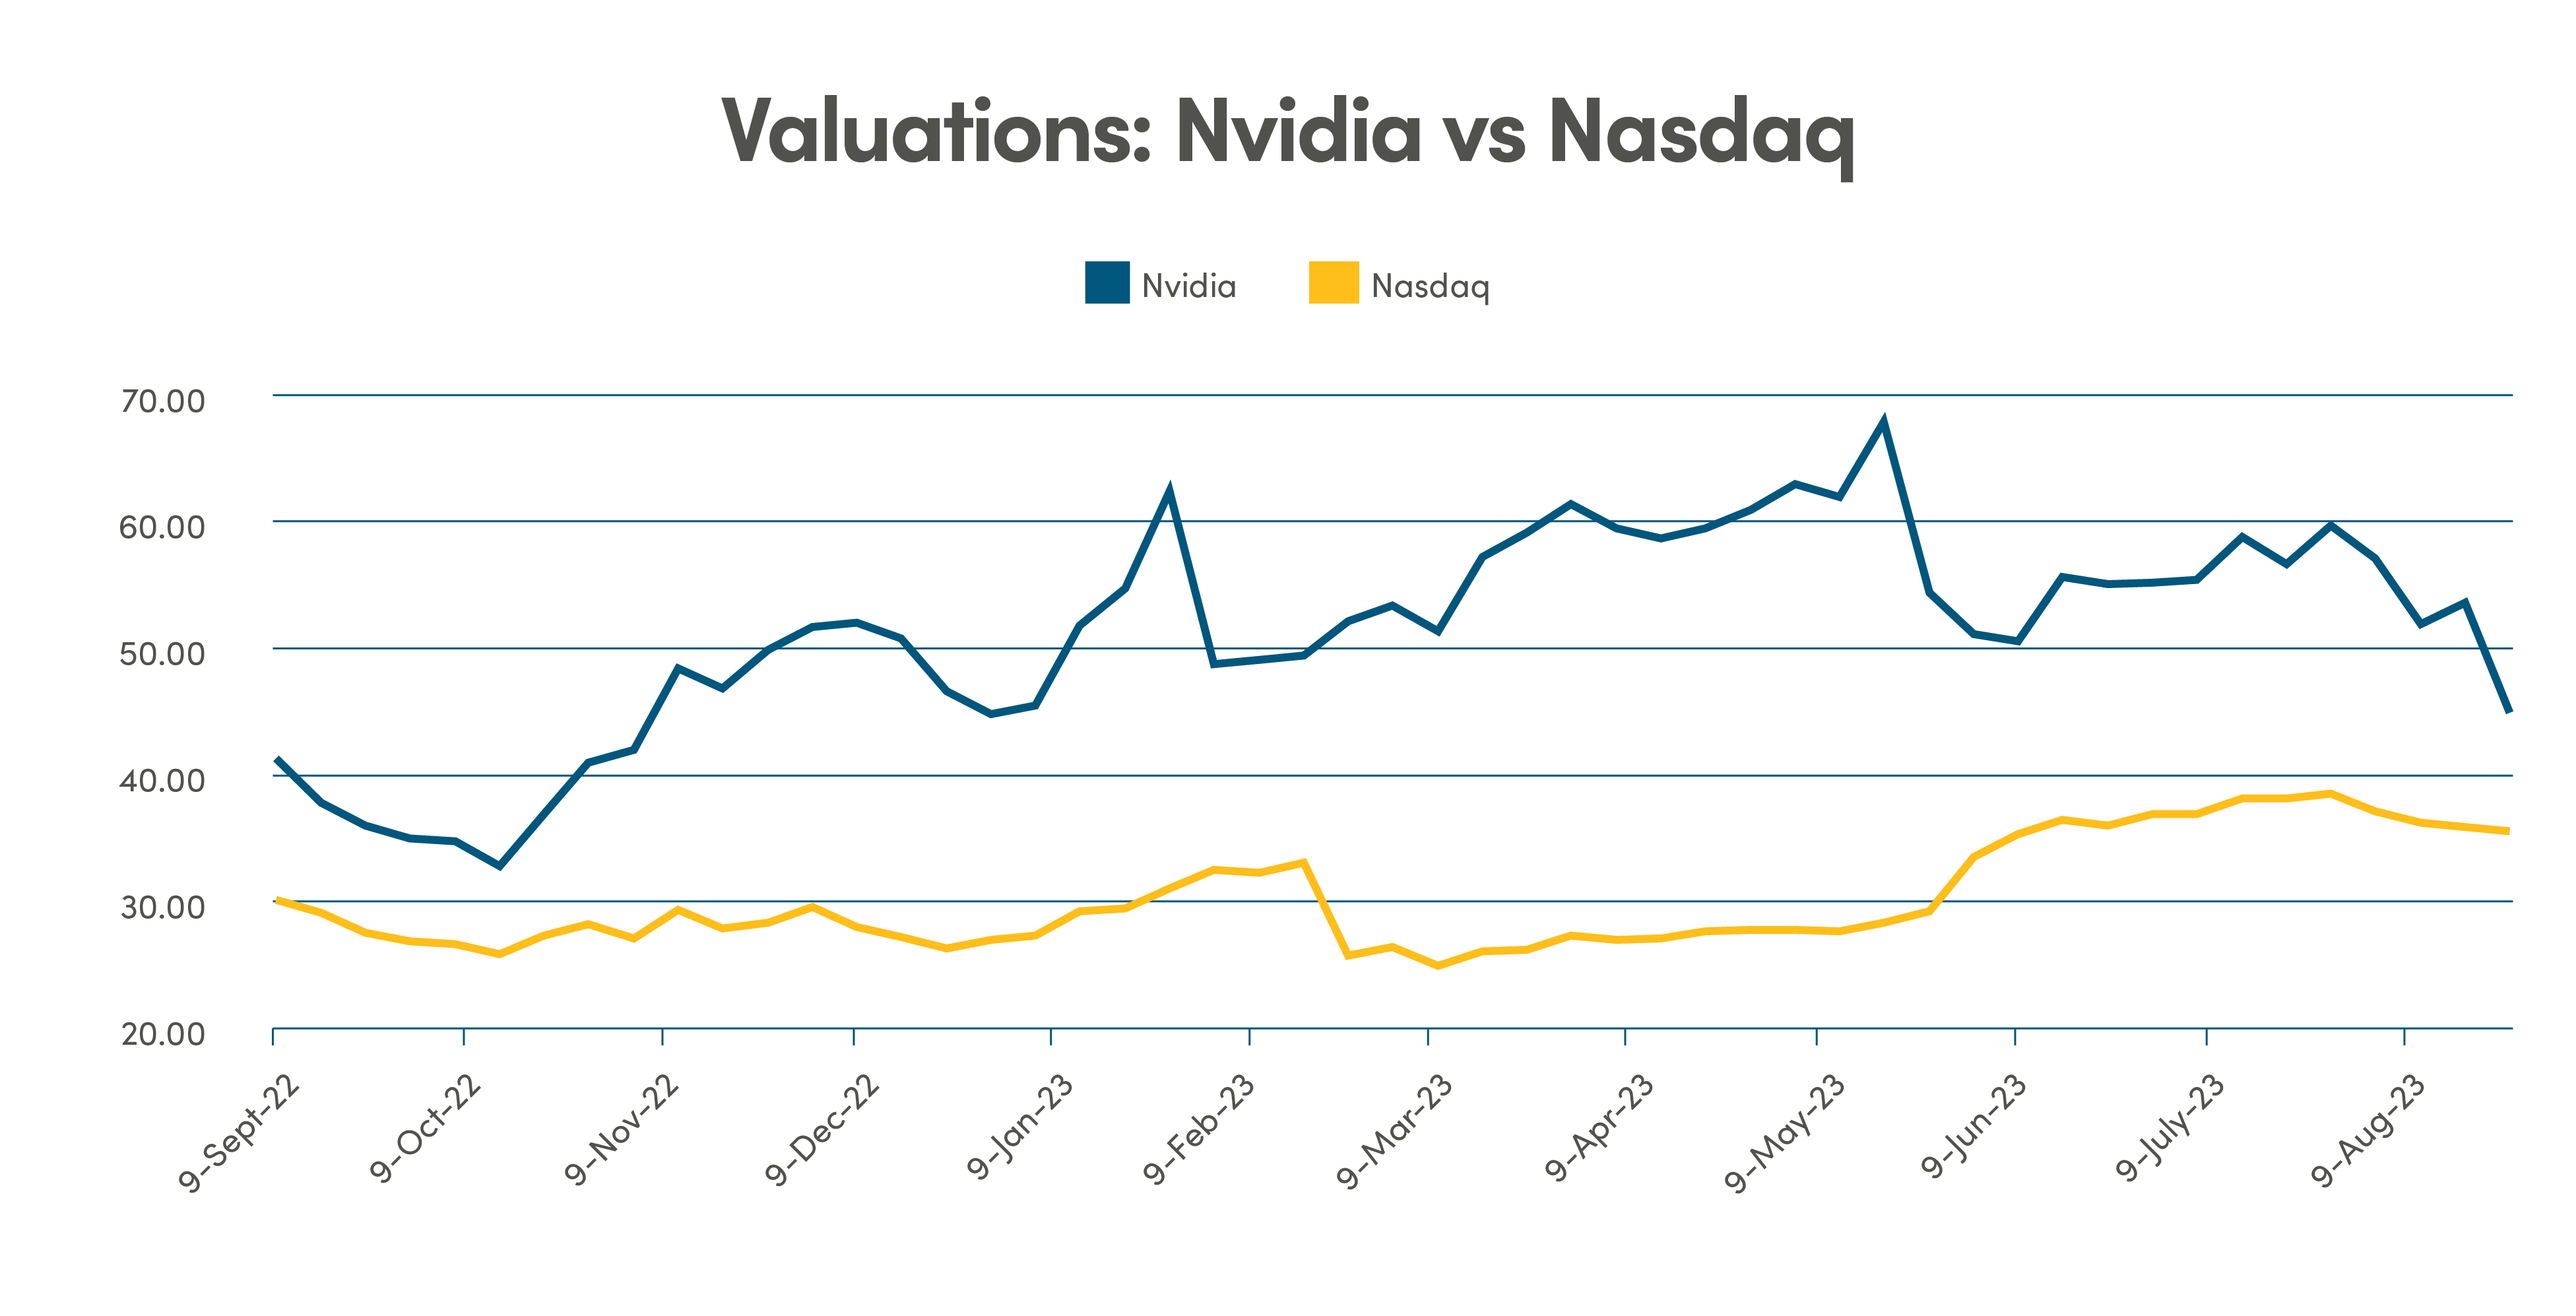
For example, Nvidia’s second quarter blockbuster earnings beat analyst estimates by a wide margin. Coupled with projected increases in chip supply and the announcement of share buybacks, Nvidia was up over 6% after hours. The recent performance of technology stocks with a focus on AI has put Nvidia under the microscope and although the stock initially rallied on this news, the days following the announcement—given the stock’s already sky-high valuation—some of profit taking by investors brought the stock back to previous levels.

Source: Source: Bloomberg data as of August 31, 2023
Global growth expected to slow
Thanks to rising gas prices and base year effects, inflation may register higher levels in the near term, as large monthly declines from summer of 2022 no longer impact the 12-month inflation movement. However, inflation is expected to continue to go lower by year end, as rent and wage growth inflation are showing early signs of moderation.
Multiple indicators are also pointing to a slowdown in global growth. For example, the Fed’s latest Senior Loan Officer Opinion Survey (SLOOS) revealed that consumer and business loans weakened and that banks anticipate the ongoing tightening of lending standards to continue in the second half.
Labour market data pointed to a cooling but still strong jobs market in July, with payroll job gains of 187,000, slightly below consensus expectations for 200,000. Unemployment ticked down to 3.5%, while average hourly earnings were slightly stronger than expected at 4.4% year-on-year.
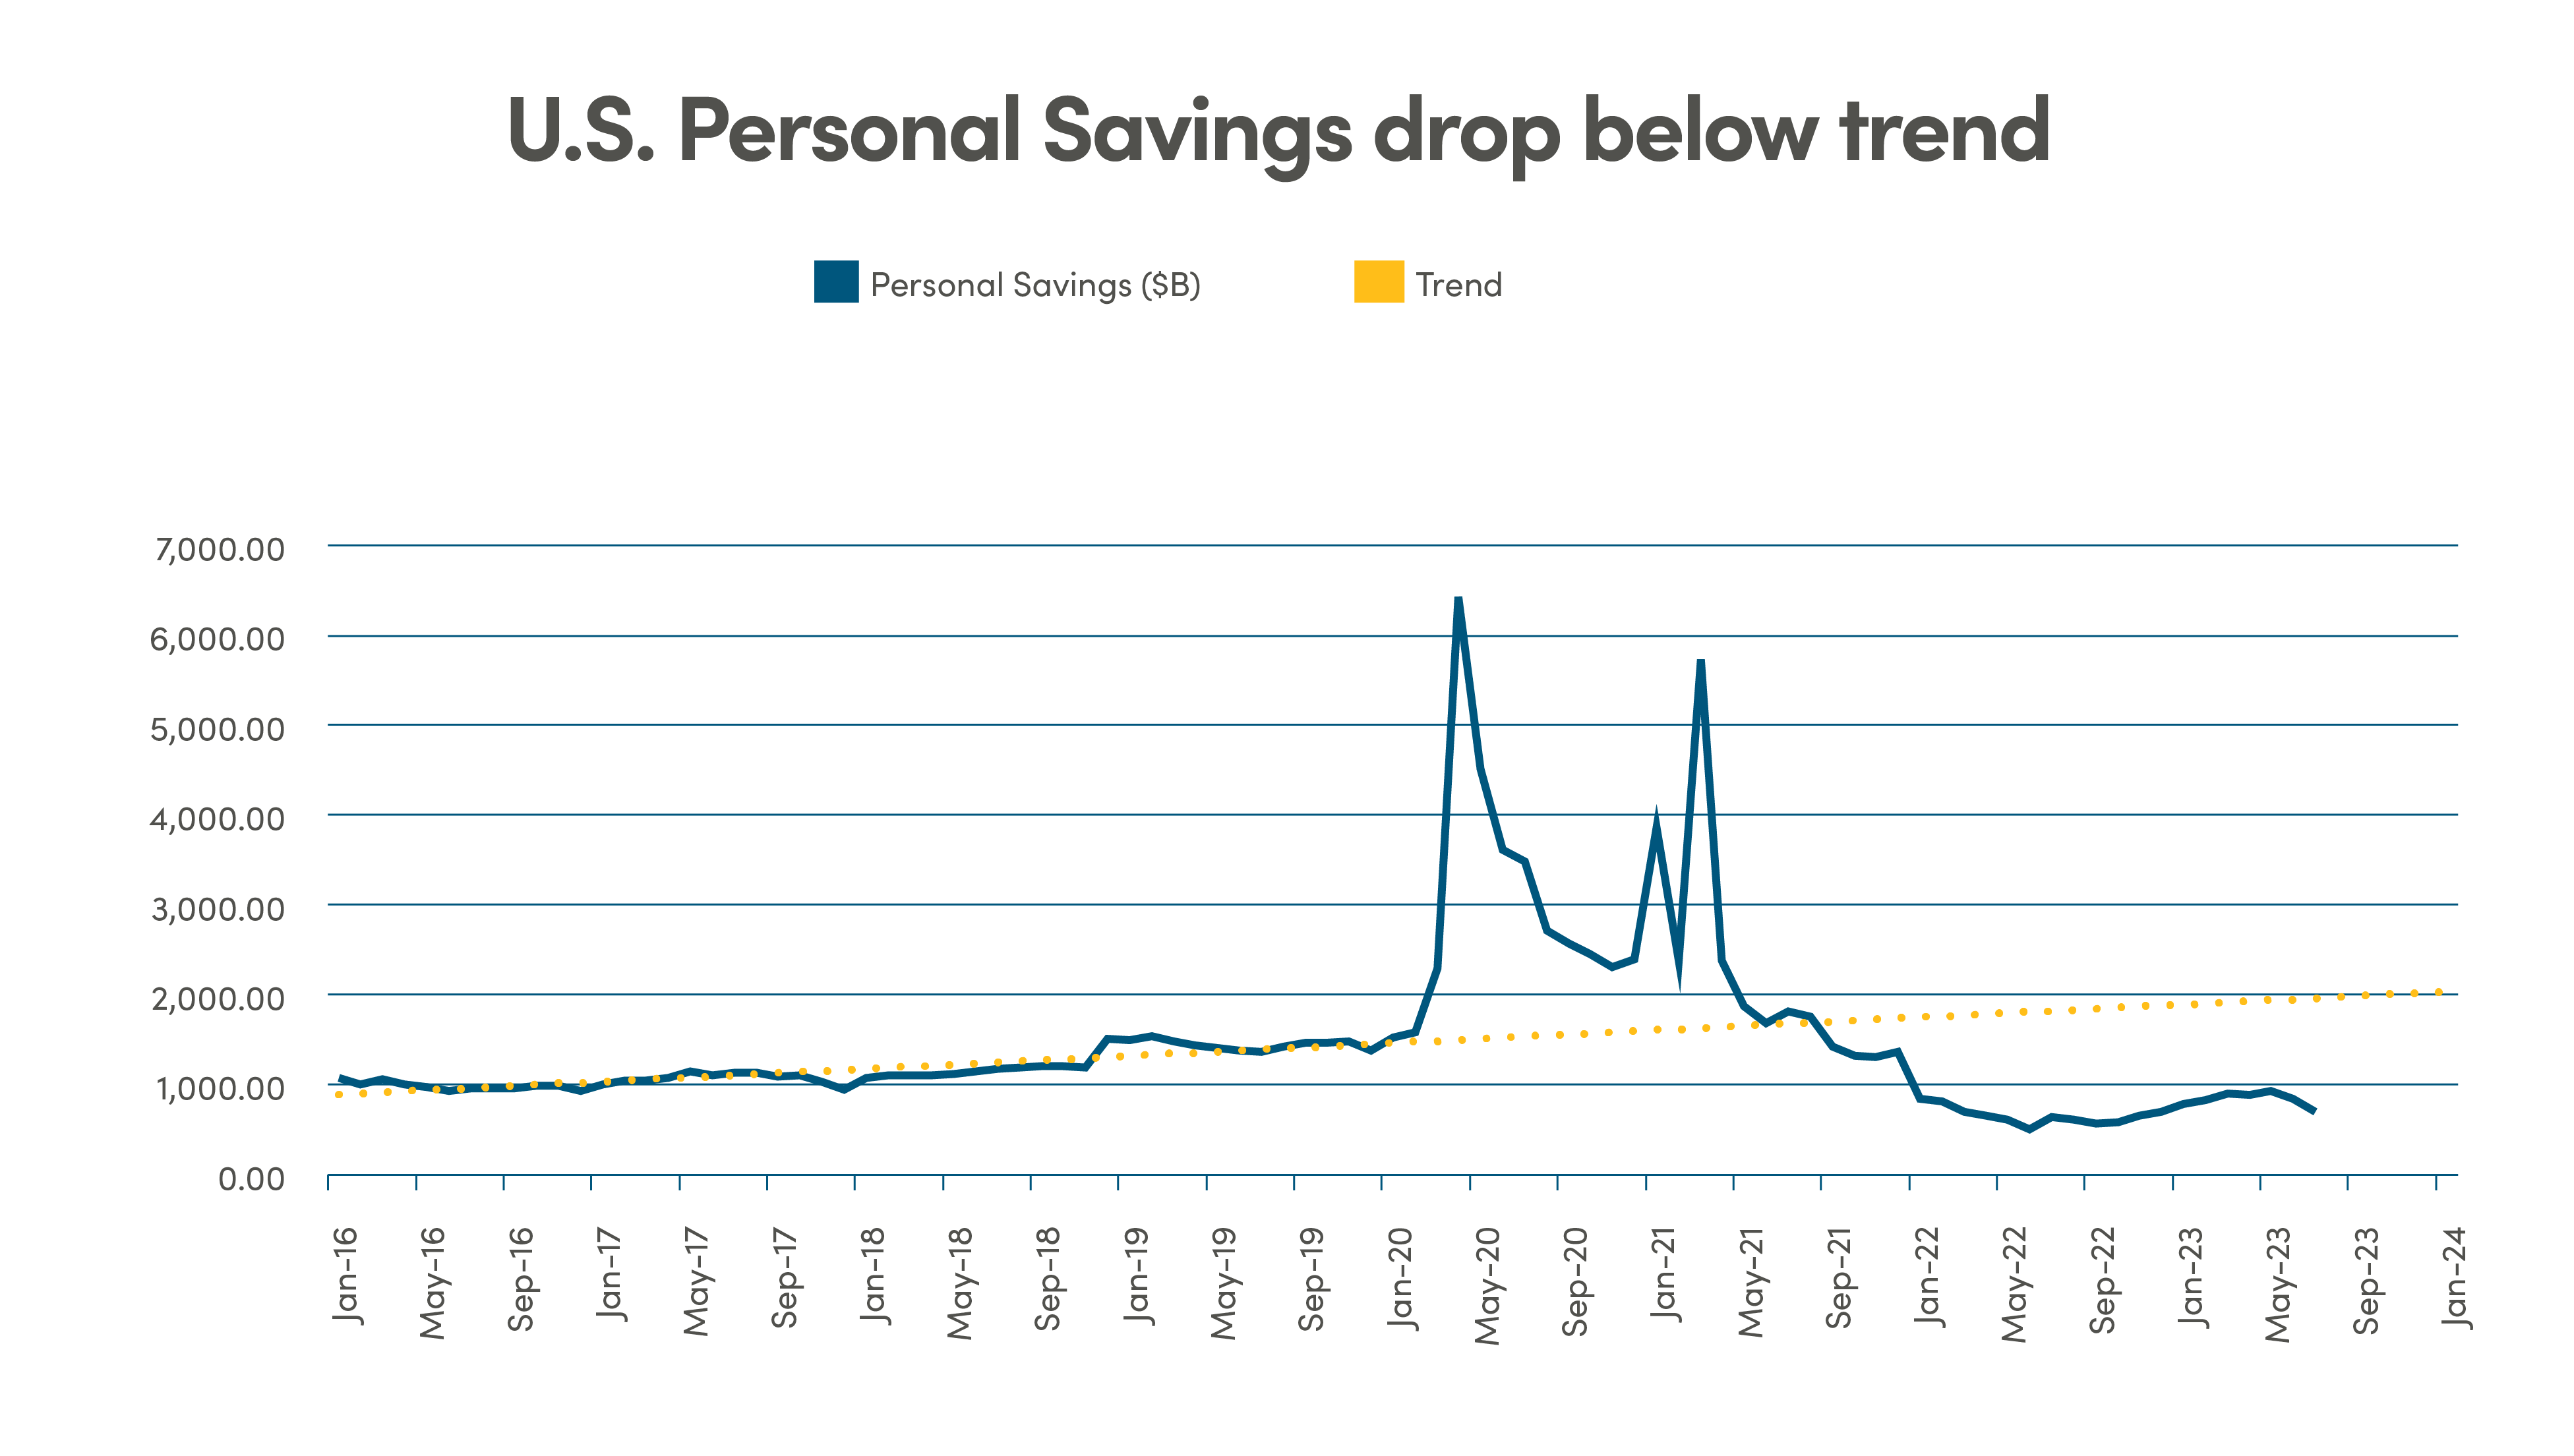
The resilience of consumers through 2023 surprised many investors, but there is growing evidence which suggests that many of the factors supporting consumer resilience are winding down. Consumer strength is likely to fade as factors supporting growth in income and spending are waning (labour market normalizing and excess savings are running out). Excess savings for U.S. households when adjusting for inflation are now fully exhausted from 2021 highs. In addition, although still at low absolute levels, credit card and auto loan delinquencies are beginning to pick up.

Source: Source: Bloomberg data as of August 31, 2023
China’s contraction negatively impacting Europe
In China, activity data was much weaker than expected. Deteriorating trade data continued to deliver a pessimistic signal about the global manufacturing cycle. The recent export was marginally higher in August, exports have seen their sharpest drop since early in the pandemic in 2020. This is having a significant impact on Europe. On the manufacturing front, Europe's weak performance is interlinked with China's slowing growth momentum, significantly impacting countries like Germany that are heavily reliant on Chinese demand.

Legal
Aviso Wealth Inc. (“Aviso”) is the parent company of Aviso Financial Inc. (“AFI”) and Northwest & Ethical Investments L.P. (“NEI”). Aviso and Aviso Wealth are registered trademarks owned by Aviso Wealth Inc. NEI Investments is a registered trademark of NEI. Any use by AFI or NEI of an Aviso trade name or trademark is made with the consent and/or license of Aviso Wealth Inc. Aviso is a wholly-owned subsidiary of Aviso Wealth LP, which in turn is owned 50% by Desjardins Financial Holding Inc. and 50% by a limited partnership owned by the five Provincial Credit Union Centrals and The CUMIS Group Limited.
This material is for informational and educational purposes and it is not intended to provide specific advice including, without limitation, investment, financial, tax or similar matters. This document is published by AFI and unless indicated otherwise, all views expressed in this document are those of AFI. The views expressed herein are subject to change without notice as markets change over time. Views expressed regarding a particular industry or market sector should not be considered an indication of trading intent of any funds managed by NEI Investments. Forward-looking statements are not guaranteed of future performance and risks and uncertainties often cause actual results to differ materially from forward-looking information or expectations. Do not place undue reliance on forward-looking information. Mutual funds and other securities are offered through Aviso Financial Inc. Commissions, trailing commissions, management fees and expenses all may be associated with mutual fund investments. Please read the prospectus before investing. Unless otherwise stated, mutual fund securities and cash balances are not insured nor guaranteed, their values change frequently and past performance may not be repeated.
The MSCI information may only be used for your internal use, may not be reproduced or re-disseminated in any form and may not be used as a basis for or a component of any financial instruments or products or indices. None of the MSCI information is intended to constitute investment advice or a recommendation to make (or refrain from making) any kind of investment decision and may not be relied on as such. Historical data and analysis should not be taken as an indication or guarantee of any future performance, analysis, forecast or prediction. The MSCI information is provided on an “as is” basis and the user of this information assumes the entire risk of any use made of this information. MSCI, each of its affiliates and each other person involved in or related to computing, computing or creating any MCI information (collectively, the “MSCI Parties”) expressly disclaims all warranties (including, without limitation, any warranties of originality, accuracy, completeness, timeliness, non-infringement, merchantability and fitness for a particular purpose) with respect to this information. Without limiting any of the foregoing, in no event shall any MSCI Party have any liability for any direct, indirect, special, incidental, punitive, consequential (including, without limitation, lost profits) or any other damages.